在 IDL 中使用 QHULL 例程围绕一组随机点构建最大凸多边形
QHULL是IDL中用于应用Quick Hull算法实现多种功能的例程。其中一个应用场景是在一组随机点周围构建最大凸多边形。
下面的IDL代码示例展示了如何在此类场景中使用QHULL,以及如何定位输出多边形的质心。
QHULL例程会输出顶点列表,用于围绕输入点集构建最大凸多边形。但是这些顶点的顺序未必正确。
IDL> PRINT,t

2                         7

5                         0

7                         5

0                         3

3                         2
上述输出应按以下方式解读:
- 第1行: 应在输入数据集的点2和点7之间绘制连线
- 第2行: 应在输入数据集的点5和点0之间绘制连线
- 第3行: 应在输入数据集的点7和点5之间绘制连线
- 第4行: 应在输入数据集的点0和点3之间绘制连线
- 第5行: 应在输入数据集的点3和点2之间绘制连线
为了绘制这个多边形,需要将顶点按连续线的顺序排列,即:
2 >> 7 >> 5 >> 0 >> 3 >> 2
顶点的重新排序通过一个FOR循环实现:该循环遍历变量t的第二列中的各个点,并以适当方式排序以形成连续路径。最终输出的verts变量将包含有序的顶点序列:
IDL > PRINT," Polygon vertices order: ", verts

Polygon vertices order: 2    7    5    0    3    2
代码示例:
PRO test_qhull


; input the x and y coordinates of the point cloud

x1=double([6.712645 , 6.712720 , 6.712706 , 6.712648, 6.712660 , 6.712706 , 6.71270, 6.7127685])

y1=double([49.406416, 49.406440, 49.406377 , 49.406376, 49.406420, 49.406456 , 49.406390, 49.406416])


; display the input points

p=PLOT(x1, y1,LINESTYLE=6,SYM_SIZE=0.5,SYMBOL='o',SYM_FILLED=0,title='QHULL Test', COLOR='red',DIMENSIONS=[1000,400 ])


; run QHULL routine and display the output t variable including the vertices of the largest convex POLYGON of this point cloud

QHULL,x1, y1, t

PRINT," Output list of vertices (t variable) from QHULL: "

PRINT, t


; determine the vertices order from the t output variable from QHULL, and print the vertices order

verts=INTARR(N_ELEMENTS(t[0,*])+1)

verts[0]=t[0,0]

verts[1]=t[1,0]

FOR i=1,N_ELEMENTS(t[0,*])-1 DO BEGIN

  id=WHERE(t[0,*] EQ verts[i])

  verts[i+1]=t[1,id]

ENDFOR

PRINT," Polygon vertices order: ", verts


; order the points in x1 and y1 vectors based on vertices order

x2=x1[verts]

y2=y1[verts]


; determine the centroid of the polygon using the IDLanROI object

roi=IDLanROI()

roi.SetProperty,Data=TRANSPOSE([[x2],[y2]])

a=roi.ComputeGeometry(CENTROID=center1)


; display the POLYGON and its centroid on the original graphic

p=PLOT(x2, y2,LINESTYLE=0, COLOR='blue',/OVERPLOT)

p=PLOT([center1[0],center1[0]], [center1[1],center1[1]],LINESTYLE=6,SYM_SIZE=2,SYMBOL='s',COLOR='green',/OVERPLOT)


END
将生成类似于以下内容的图形:
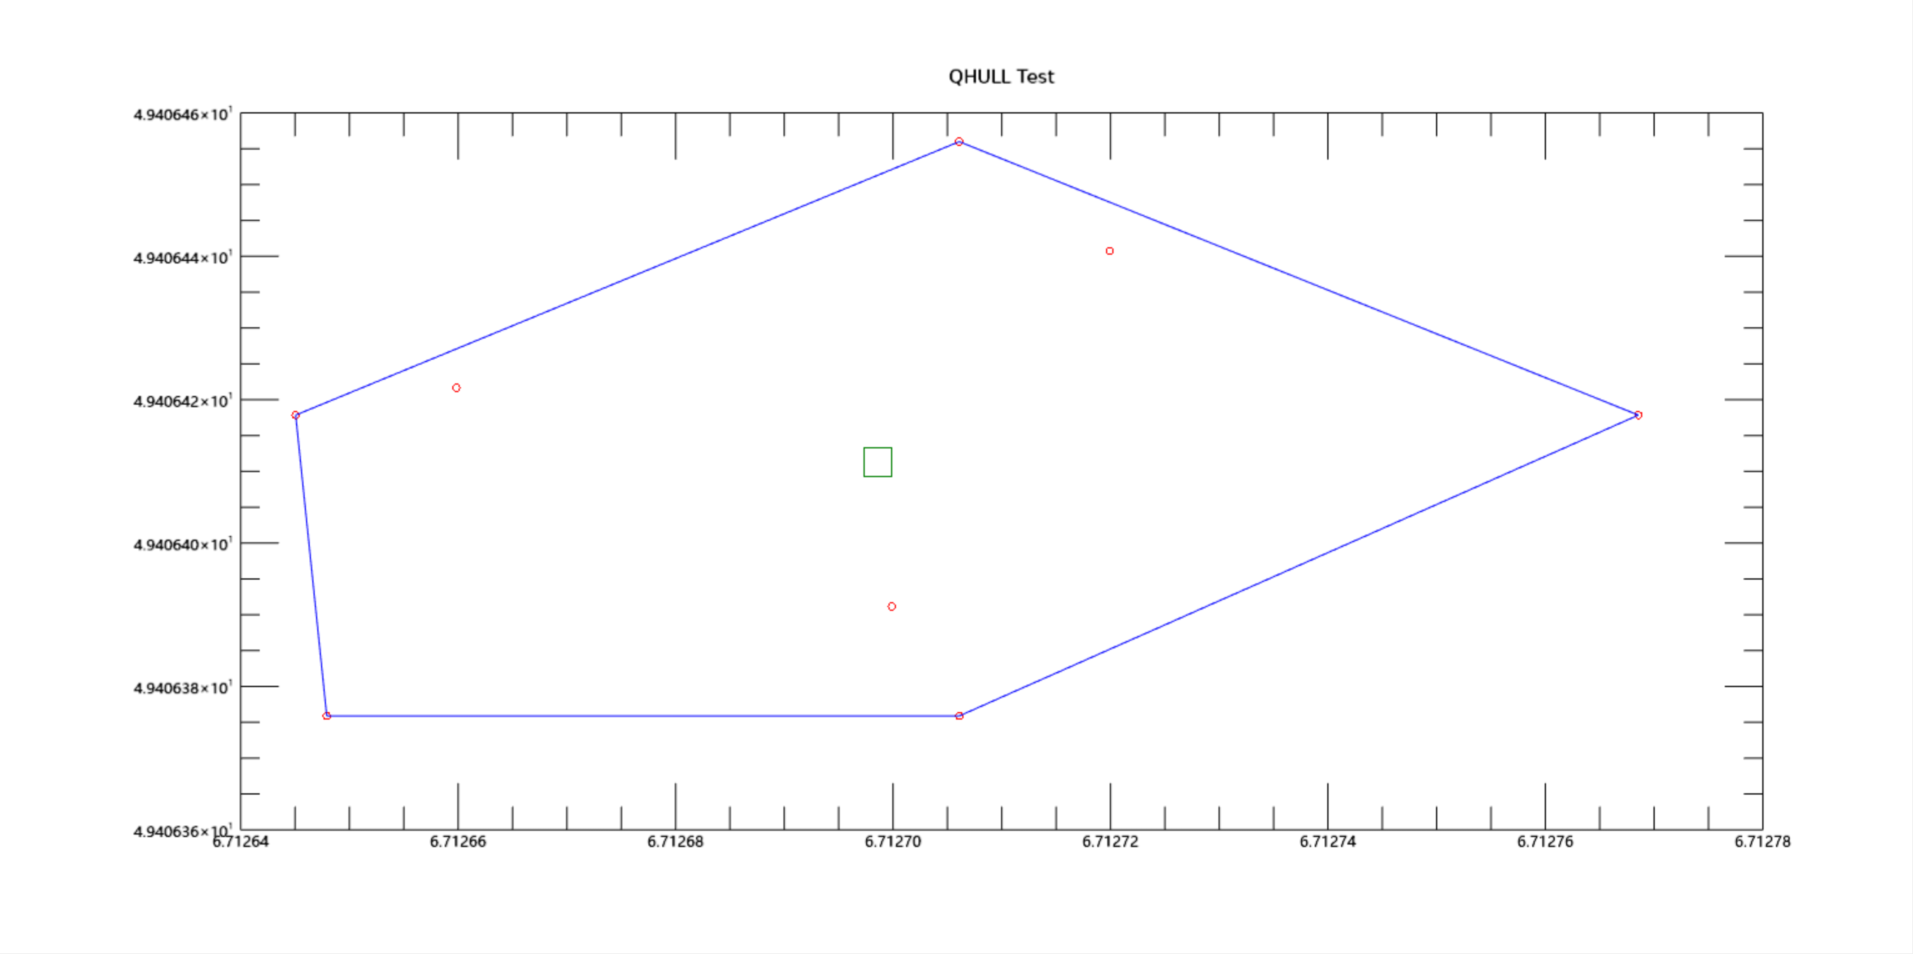
参考文献: "The Quickhull Algorithm for Convex Hulls", ACM Transactions on Mathematical Software, Vol. 22, No 4, December 1996, Pages 469-483, Barber, Dobkin and Huhdanpaa

 浙公网安备 33010602011771号