
Content
- solve Xshell connect
- gismo: gnuplot//
- Link:http://gnuplot.sourceforge.net/demo/
- Link:Thinks this brother
Xx_Why
Today,I be free and at leisure,play with Xshell connect parrot,shit,not success!
Ax_Solve
one->start ssh service
service ssh start
two->close firewall
service iptables stop
chkconfig iptables off
Next,connect
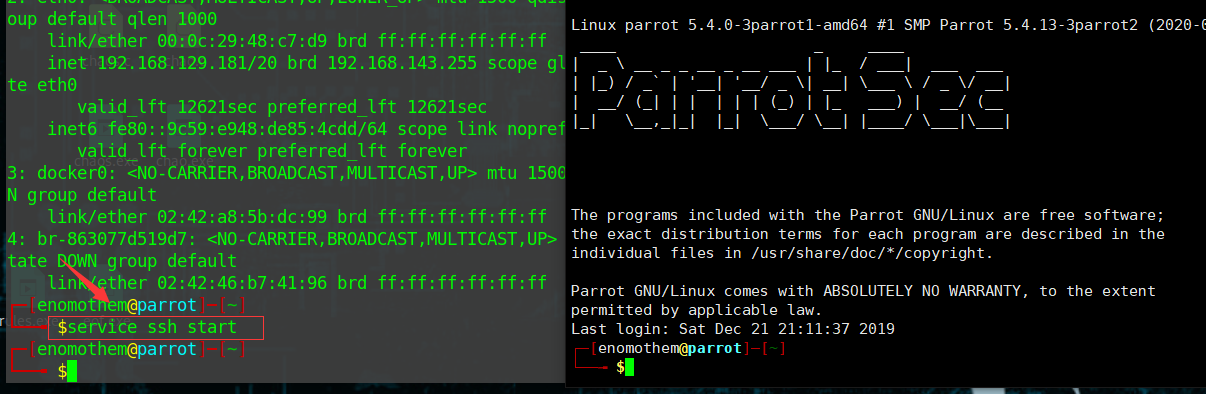
Oh,my god,too fuck luck.
Bx_What is Gnuplot?
Gnuplot is a portable command-line driven graphing utility for Linux, OS/2, MS Windows, OSX, VMS, and many other platforms.
Cx_Tell the truth,I don't care,I neet to play it.
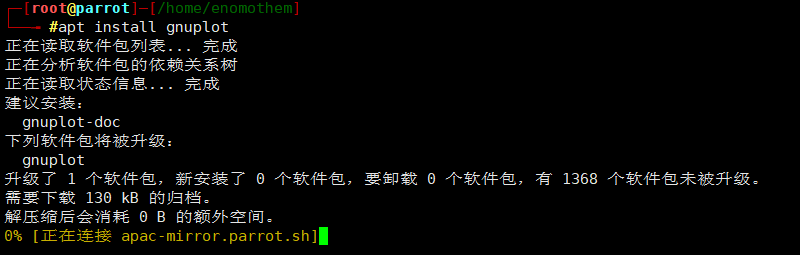
Above all install it\
apt install gnuplot
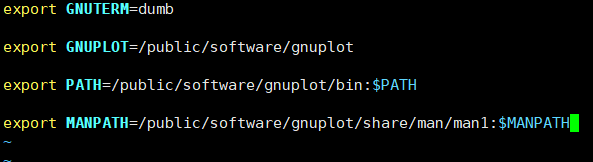
Configure environment variables
vi /etc/profile.d/gnuplot.sh
export GNUTERM=dumb
export GNUPLOT=/public/software/gnuplot
export PATH=/public/software/gnuplot/bin:$PATH
export MANPATH=/public/software/gnuplot/share/man/man1:$MANPATH
wq
Start up environment
source /etc/profile.d/gnuplot.sh
Test runing
gnuplot
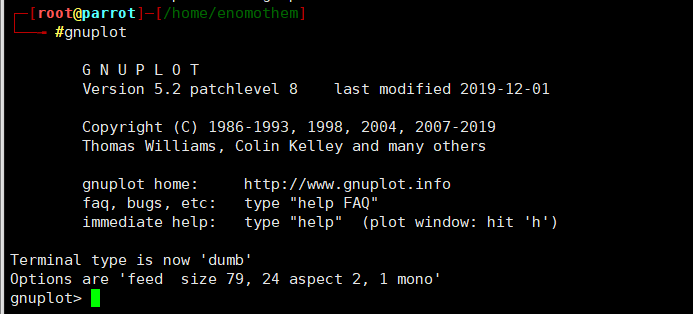
yeah,success start
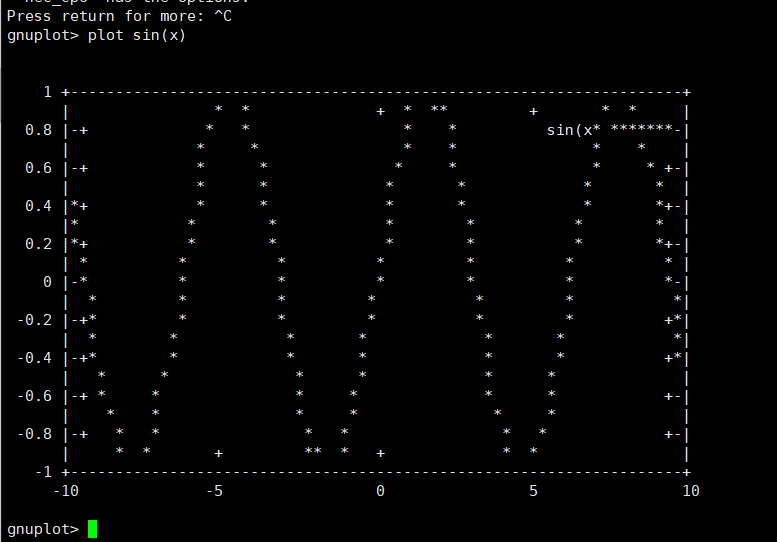
wow~
great!
What's fun
vi a.plt
set pm3d
set view 0,0
unset ztics
set isosamples 200,200
splot x**2+y**2 w pm3d
set term post color
set output ‘a.ps’
replot
wq
gnuplot
load 'a.plt'

vi b.plt
# set terminal pngcairo  transparent enhanced font "arial,10" fontscale 1.0 size 600, 400
# set output 'surface2.1.png'
set bar 1.000000 front
set style circle radius graph 0.02, first 0.00000, 0.00000
set style ellipse size graph 0.05, 0.03, first 0.00000 angle 0 units xy
set dummy u, v
set key bmargin center horizontal Right noreverse enhanced autotitle nobox
set style textbox transparent margins  1.0,  1.0 border
unset logscale
set parametric
set view 45, 50, 1, 1
set isosamples 50, 10
set hidden3d back offset 1 trianglepattern 3 undefined 1 altdiagonal bentover
set style data lines
set ztics  norangelimit -1.00000,0.25,1.00000
unset paxis 1 tics
unset paxis 2 tics
unset paxis 3 tics
unset paxis 4 tics
unset paxis 5 tics
unset paxis 6 tics
unset paxis 7 tics
set title "Parametric Sphere"
set urange [ -1.57080 : 1.57080 ] noreverse nowriteback
set vrange [ 0.00000 : 6.28319 ] noreverse nowriteback
set paxis 1 range [ * : * ] noreverse nowriteback
set paxis 2 range [ * : * ] noreverse nowriteback
set paxis 3 range [ * : * ] noreverse nowriteback
set paxis 4 range [ * : * ] noreverse nowriteback
set paxis 5 range [ * : * ] noreverse nowriteback
set paxis 6 range [ * : * ] noreverse nowriteback
set paxis 7 range [ * : * ] noreverse nowriteback
set colorbox vertical origin screen 0.9, 0.2, 0 size screen 0.05, 0.6, 0 front  noinvert bdefault
splot cos(u)*cos(v),cos(u)*sin(v),sin(u)
wq
gnuplot
load 'b.plt'
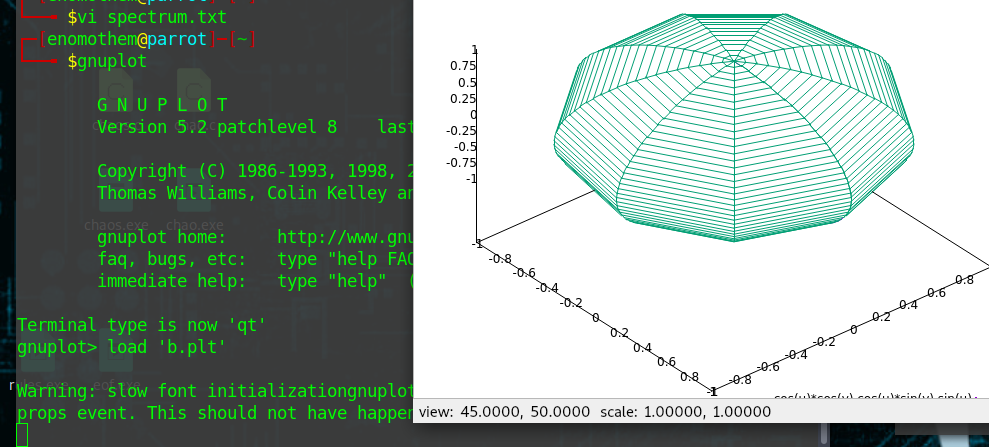
Oh~,universe,This is UFO??miraculous
Now,We are Create one data text
vi data.txt
1990 33 45 18
1991 35 42 19
1992 34 44 14
1993 47 15 30
1994 41 14 32
1995 42 20 35
gnuplot
plot "data.txt" using 2 title "Red" with histograms, "" using 3 title "Green" with histograms, "" using 4 title "Blue" with histograms

# bar1
set style fill solid
set palette rgbformulae 7,5,15
plot "data.txt" using 2 title "A" w histograms palette frac 0.1, "" u 3 t "B" w histograms palette frac 0.5, "" u 4 t "C" w histograms palette frac 0.9

# bar3
set style fill solid
set palette rgbformulae 3,11,6
plot "data.txt" using 2 title "a" w histograms palette frac 0.1, "" u 3 t "b" w histograms palette frac 0.5, "" u 4 t "c" w histograms palette frac 0.9

# bar3
set style fill solid
set palette rgbformulae 33,13,10
plot "data.txt" using 2 title "a" w histograms palette frac 0.1, "" u 3 t "b" w histograms palette frac 0.5, "" u 4 t "c" w histograms palette frac 0.9


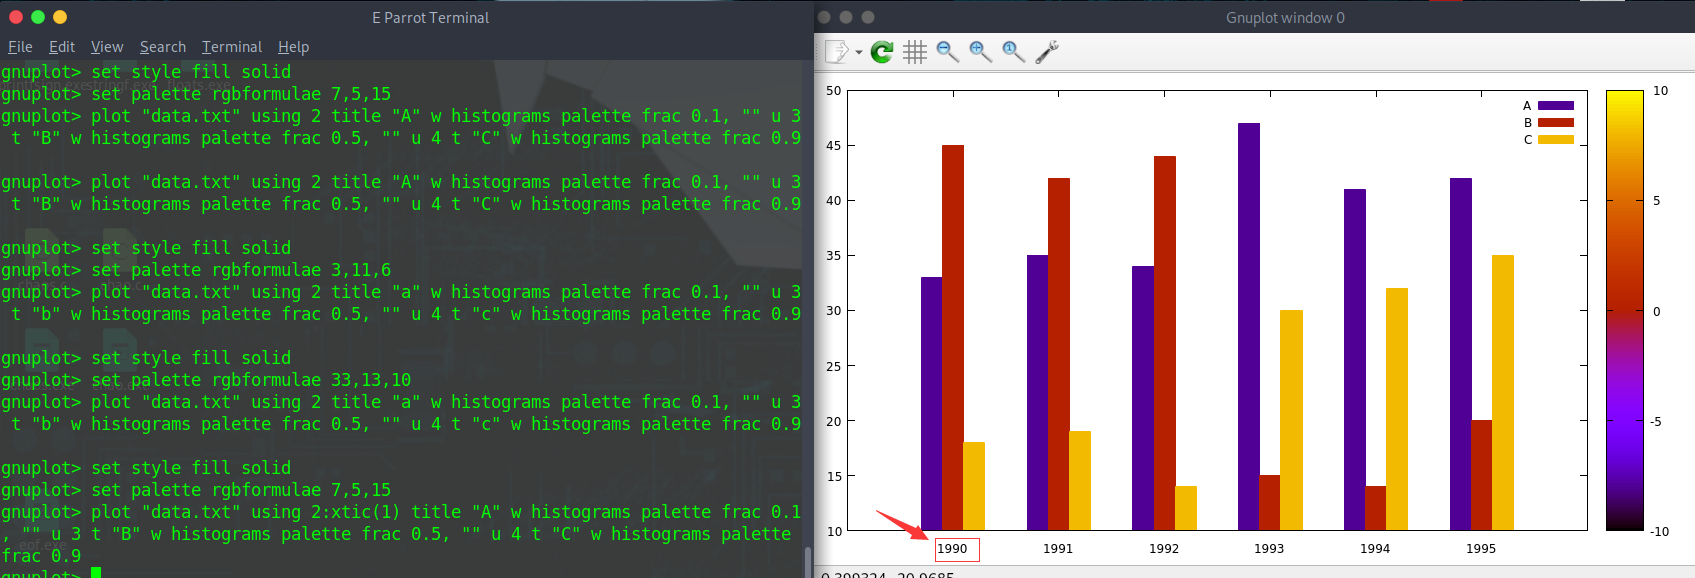
# display years
set style fill solid
set palette rgbformulae 7,5,15
plot "data.txt" using 2:xtic(1) title "A" w histograms palette frac 0.1, "" u 3 t "B" w histograms palette frac 0.5, "" u 4 t "C" w histograms palette frac 0.9

 浙公网安备 33010602011771号