原文链接
和金融相关的python包
0 摘要
包(package)可以理解为他人制作的工具,通常是为了解决某种特定的经常性的需求而诞生的。
为什么要重视包?
1. 包的使用可以极大地提升效率。比如,你需要计算某种复杂的金融指标或构建衍生品模型,如果从头开始构建是费时费力的。这时,借助别人写好的包,使用现成的模型,写几行代码,只需输入参数即可。
2. 包的发现可以扩展知识面。包的诞生从来都是为了解决某种问题的,而发现越多的包,便可以扩大知识的广度。
3. 包的发现可以侦查到技术热点。对于新的问题,可能需要新的工具解决。因此,关注新诞生的包或包的更新说明,可以发掘到技术上的热点。
对于同一个问题,包的数量可能太多了,如何选择适当的包?
1. 历史悠久的,常见的。
2. GitHub中star多的。
3. 社区活跃的。
4. 最好选择有中文文档的。
5. 更新频繁的。
6. 功能强大,功能齐全的。
数据分析大致可分为三个部分,针对金融数据的分析也不例外。因此,下面按照这三个部分来介绍和金融相关的python包。

1 数据存储与获取
1.1 数据接口
抛开python,一般的获取金融数据的方法有哪些呢?从媒体上获取、从交易所官网获取、从财经网站获取。这些网站一般都会提供一个接口(API),使用各种编程语言都可以通过接口来直接获取数据。
1.2 python 操作excel
有时我们获得的数据是本地excel数据,这时就需要通过python读取excel数据,比如pandas中 read_excel 和 read_csv 便可以实现。如果想进行更高级更精细的操作,就可以使用专门的包来实现。
| 名称 | 网址 | 简介 |
| xlwings | https://www.xlwings.org/ | python操作excel |
| openpyxl | https://openpyxl.readthedocs.io/en/latest/ | python操作excel |
| xlrd | https://github.com/python-excel/xlrd | python操作excel |
| xlsxwriter | https://xlsxwriter.readthedocs.io | python操作excel |
| datanitro | https://datanitro.com/ | 在excel中使用python |
| Grid Studio | https://gridstudio.io/ | 在excel中使用python |
| ExPy | http://www.bnikolic.co.uk/expy/expy.html | 在excel中使用python |
| PyXLL | https://www.pyxll.com/ | 在excel中使用python |
| XLLoop | http://xlloop.sourceforge.net/ | 用于在服务器上实现 Excel 用户定义函数 |
2 数据处理与分析
2.1 通用数据处理
处理任何领域的数据、进行各种场景的数学计算都需要使用的包。
| 名称 | 网址 | 简介 |
| NumPy | https://numpy.org/ | 数组处理 |
| SciPy | https://www.scipy.org/ | 科学计算 |
| pandas | https://pandas.pydata.org/ | 必须学的包,相当于excel |
| quantdsl | https://github.com/johnbywater/quantdsl | 金融和交易的定量分析的特定领域语言 |
| statistics | https://docs.python.org/3/library/statistics.html | python内置统计库 |
| SymPy | https://www.sympy.org/ | 符号计算 |
| pymc3 | https://docs.pymc.io/ | 概率 |
2.2 交易日历
帮助获取交易日的信息,算是辅助功能。
| 名称 | 网址 | 简介 |
| exchange_calendars | https://github.com/gerrymanoim/exchange_calendars | 证券交易所交易日历 |
| bizdays | https://github.com/wilsonfreitas/python-bizdays | 各国交易日 |
| pandas_market_calendars | https://github.com/rsheftel/pandas_market_calendars | 基于pandas的交易日历 |
2.3 指标计算
进行金融分析时,有很多常用的金融指标,本质是一堆公式。这些公式无需重新编写,通过调包即可。比如 finta 中的:
| PHP * Simple Moving Average 'SMA' * Simple Moving Median 'SMM' * Smoothed Simple Moving Average 'SSMA' * Exponential Moving Average 'EMA' * Double Exponential Moving Average 'DEMA' |
| 名称 | 网址 | 简介 |
| pandas_talib | https://github.com/femtotrader/pandas_talib | 基于Pandas技术分析指标 |
| finta | https://github.com/peerchemist/finta | 财务指标 |
| Tulipy | https://github.com/cirla/tulipy | 金融技术分析指标 |
| lppls | https://github.com/Boulder-Investment-Technologies/lppls | LPPLS模型 |
2.4 金融工具和定价
包含各种衍生品模型的包
2.5 交易与回测
主要是各种量化平台,回测工具。
2.6 风险分析
构建投资组合与风险分析的包。
| 名称 | 网址 | 简介 |
| pyfolio | https://github.com/quantopian/pyfolio | 投资组合和风险分析 |
| empyrical | https://github.com/quantopian/empyrical | 共同的财务风险和绩效指。 |
| fecon235 | https://github.com/rsvp/fecon235 | 金融经济学的计算工具 |
| finance | https://pypi.org/project/finance/ | 金融风险计算 |
| qfrm | https://pypi.org/project/qfrm/ | 衡量、管理和可视化金融工具和投资组合风险的出色 OOP 工具 |
| visualize-wealth | https://github.com/benjaminmgross/visualize-wealth | 投资组合构建和定量分析 |
| VisualPortfolio | https://github.com/wegamekinglc/VisualPortfolio | 用于可视化投资组合的表现 |
| universal-portfolios | https://github.com/Marigold/universal-portfolios | 在线投资组合选择算法的集合 |
| FinQuant | https://github.com/fmilthaler/FinQuant | 用于金融投资组合管理、分析和优化的程序 |
| Empyrial | https://github.com/ssantoshp/Empyrial | 投资组合的风险和绩效分析以及回报预测 |
2.7 因子分析
| 名称 | 网址 | 简介 |
| alphalens | https://github.com/quantopian/alphalens | alpha因子的性能分析 |
| Spectre | https://github.com/Heerozh/spectre | GPU 加速的并行量化交易库 |
2.8 时间序列
时间序列在金融建模中是一个绕不开的话题,针对时间序列,我进行过一个更为细致的整理,详见:
https://weak.notion.site/python-911eb4b98be34d66b3242268c51ae6e5
| 名称 | 网址 | 简介 |
| ARCH | https://github.com/bashtage/arch | ARCH模型 |
| statsmodels | http://statsmodels.sourceforge.net/ | 统计模型 |
| dynts | https://github.com/quantmind/dynts | 时间序列分析和操作 |
| PyFlux | https://github.com/RJT1990/pyflux | 贝叶斯概率 |
| tsfresh | https://github.com/blue-yonder/tsfresh | 时间序列特征 |
| hasura/quandl-metabase | https://platform.hasura.io/hub/projects/anirudhm/quandl-metabase-time-series | 使用 Metabase 可视化 Quandl 的时间序列数据集 |
| Facebook Prophet | https://github.com/facebook/prophet | 为具有线性或非线性增长的多季节性产生多种季节性的高质量预测的工具 |
| tsmoothie | https://github.com/cerlymarco/tsmoothie | 时间序列平滑和异常值检测 |
3 数据展示与报告
3.1 通用数据可视化
金融数据的可视化和其他领域的数据可视化既有重叠,又有不同。重叠的是基本的图表,如箱型图、概率分布图;不同的是金融领域的专业图,如蜡烛图。
我整理的数据可视化包,详见 https://weak.notion.site/f691f8eb8a364a6299f68ec04a199a21
3.2 金融数据可视化
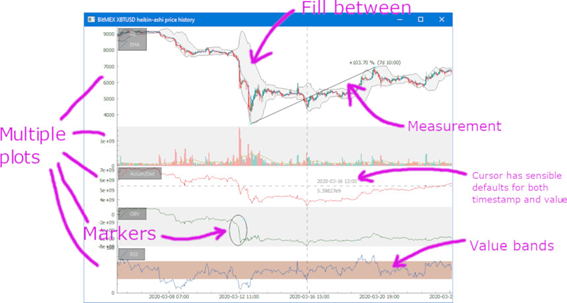
针对金融的数据可视化,下图是 finplot 的示例图。

| 名称 | 网址 | 简介 |
| dtale | https://github.com/man-group/dtale | 基于pandas |
| mplfinance | https://github.com/matplotlib/mplfinance | 基于matplotlib |
| finplot | https://github.com/highfestiva/finplot | 金融绘图 |
| finvizfinance | https://github.com/lit26/finvizfinance | 金融绘图 |
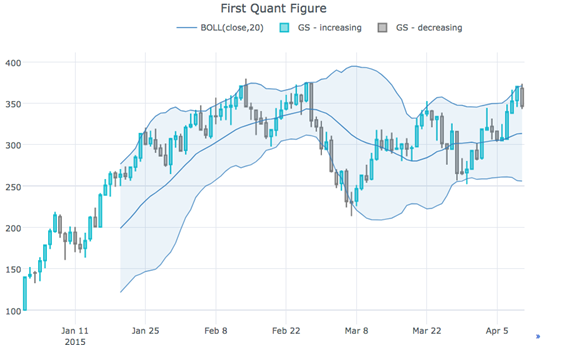
通用数据可视化的包中也可能有针对金融的数据可视化,比如 cufflinks 中的蜡烛图https://github.com/santosjorge/cufflinks

参考资料
https://github.com/wilsonfreitas/awesome-quant


 浙公网安备 33010602011771号