clc
clear
close all
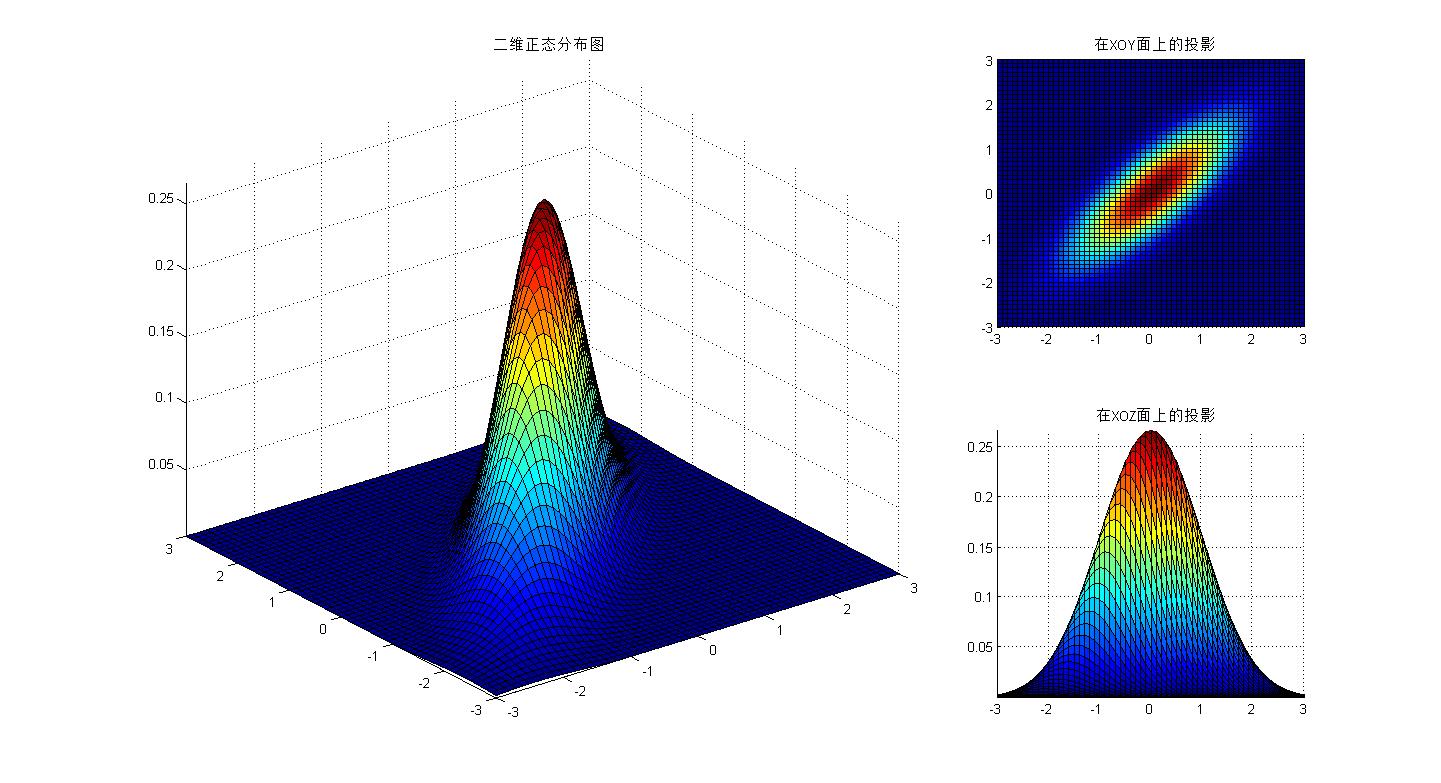
mu=[0,0];% 均值向量
Sigma=[1 0.8;0.8 1];% 协方差矩阵
[X,Y]=meshgrid(-3:0.1:3,-3:0.1:3);%在XOY面上,产生网格数据
p=mvnpdf([X(:) Y(:)],mu,Sigma);%求取联合概率密度,相当于Z轴
p=reshape(p,size(X));%将Z值对应到相应的坐标上
figure
set(gcf,'Position',get(gcf,'Position').*[1 1 1.3 1])
subplot(2,3,[1 2 4 5])
surf(X,Y,p),axis tight,title('二维正态分布图')
subplot(2,3,3)
surf(X,Y,p),view(2),axis tight,title('在XOY面上的投影')
subplot(2,3,6)
surf(X,Y,p),view([0 0]),axis tight,title('在XOZ面上的投影')


