Python matplotlib 画图入门 10 画盒图 boxplot
REF
https://matplotlib.org/stable/api/_as_gen/matplotlib.pyplot.boxplot.html
https://matplotlib.org/stable/gallery/statistics/boxplot_demo.html
https://stackabuse.com/matplotlib-box-plot-tutorial-and-examples/
https://www.scaler.com/topics/matplotlib/boxplot-matplotlib/
https://www.javatpoint.com/box-plot-in-python-using-matplotlib
https://www.nickmccullum.com/python-visualization/boxplot/


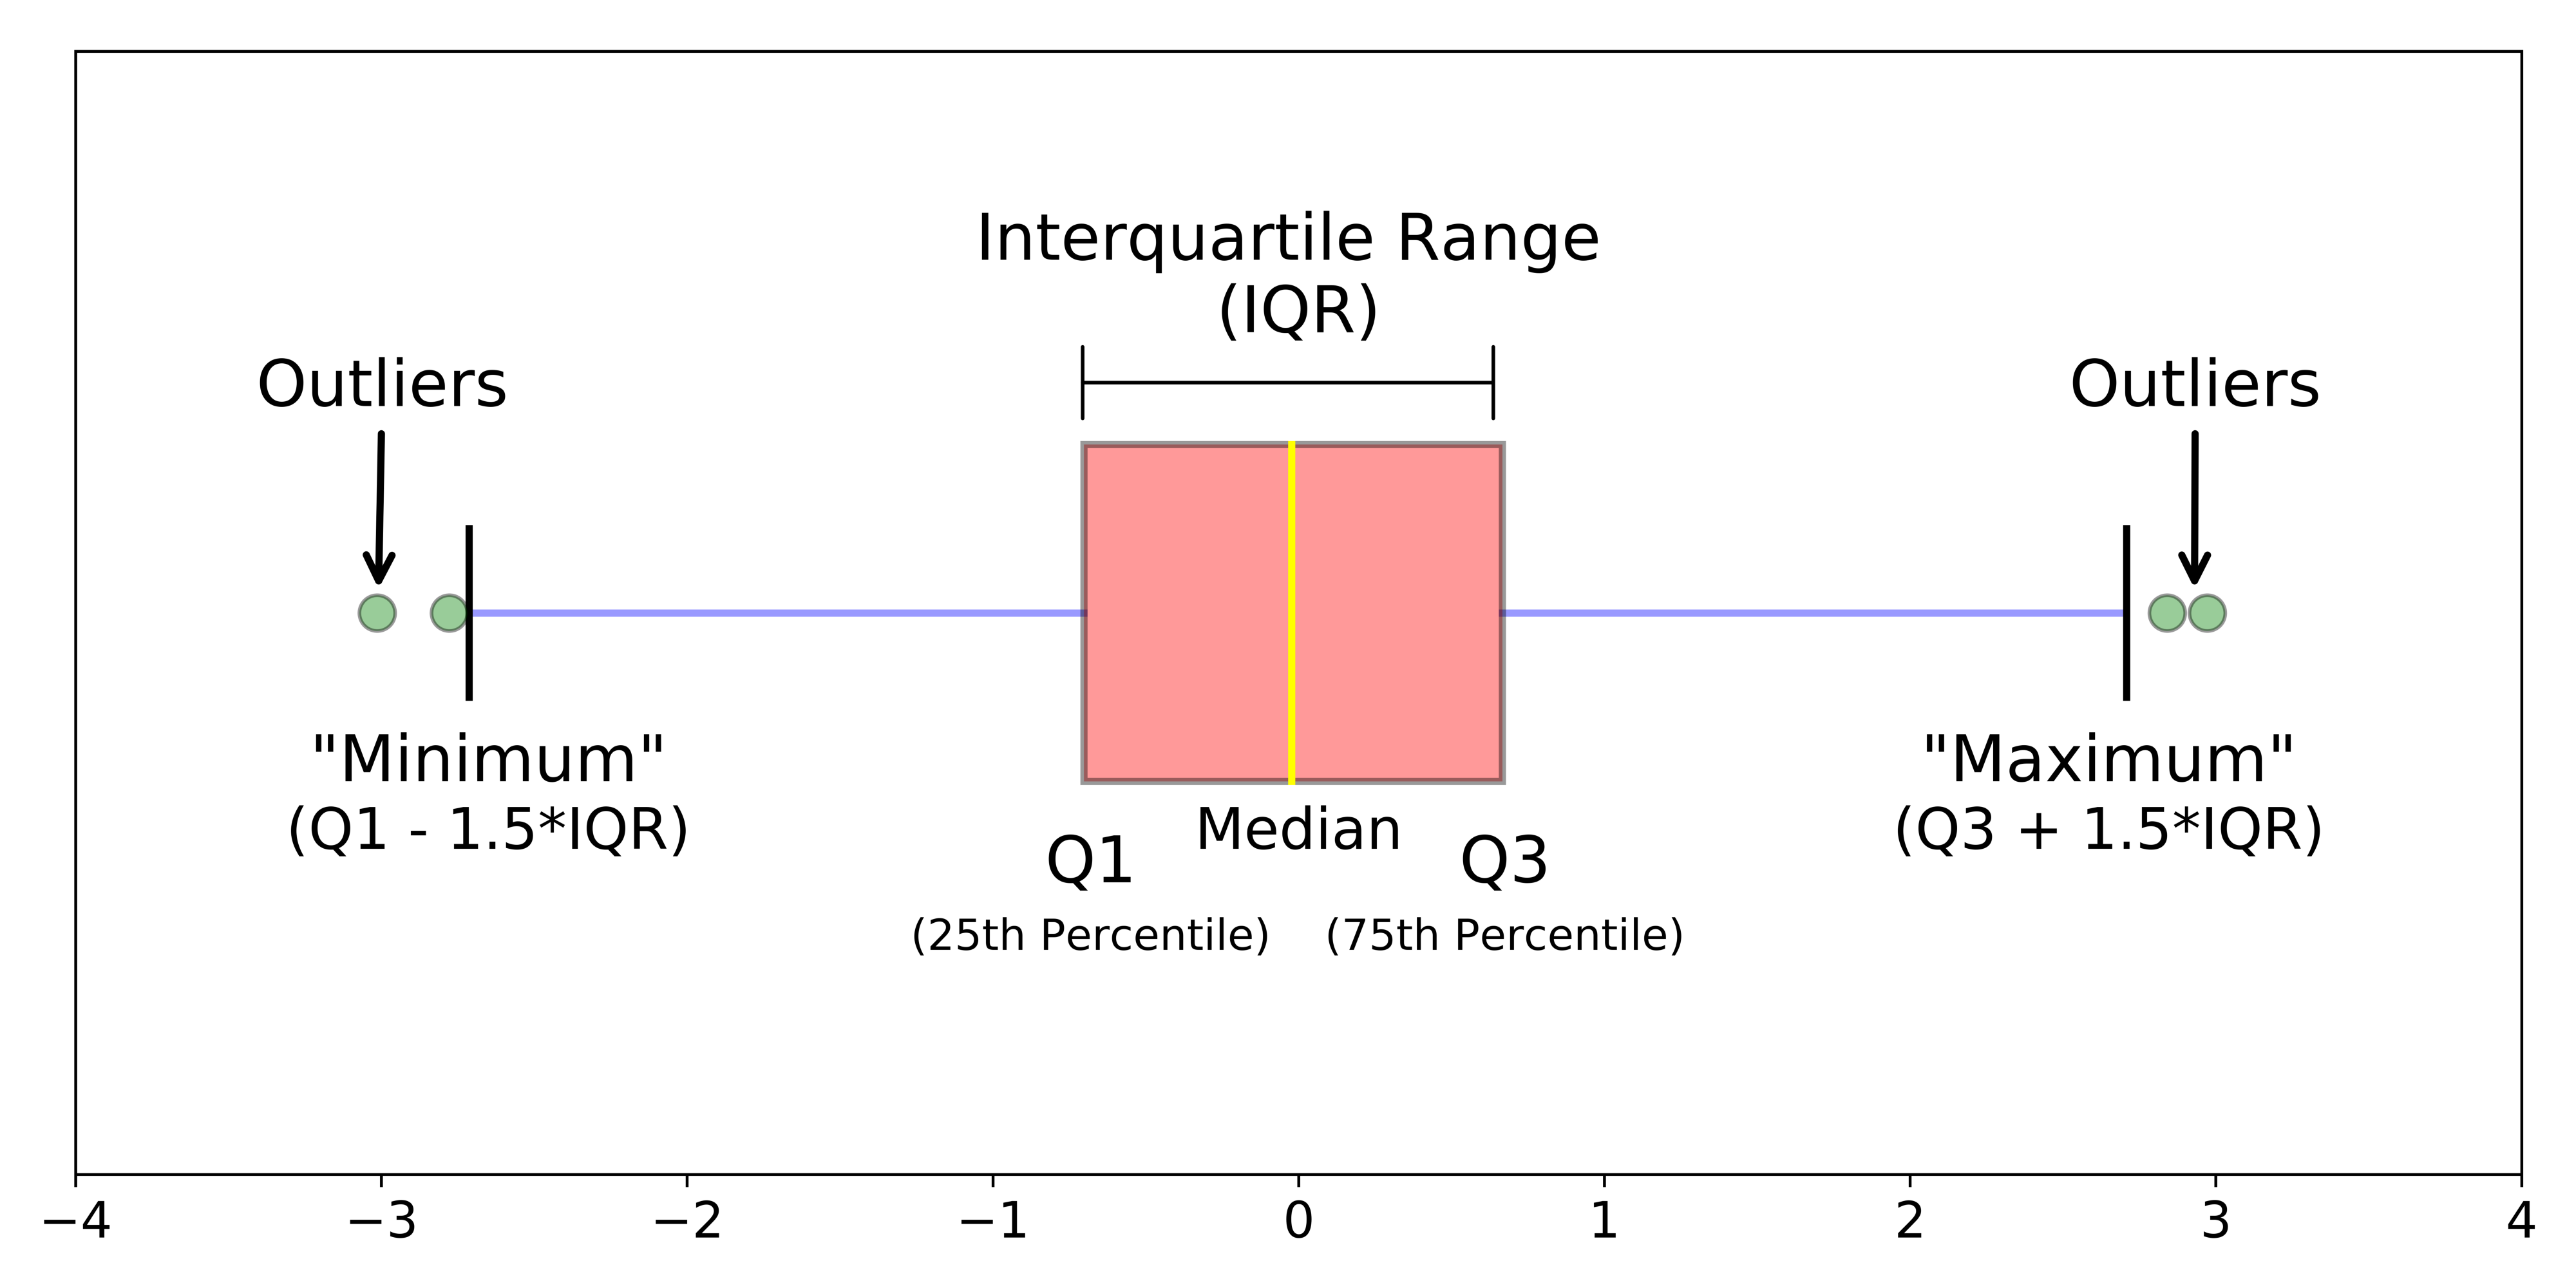
For those unfamiliar with the terminology of this diagram, they are described below:
- Q1: The first quartile of the dataset. 25% of values lie below this level.
- Q2: The second quartile of the dataset. 50% of values lie above and below this level.
- Q3: The third quartile of the dataset. 25% of values lie above this level.
- The boxplot 'Minimum', defined as Q1 less 1.5 times the interquartile range.
- The boxplot Maximum, defined as Q3 plus 1.5 times the interquartile range.
- The median: the midpoint of the datasets.
- Interquartile range: the distance between Q1 and Q3.
- Outliers: data points that are below Q1 or above Q3.
import numpy as np
import matplotlib.pyplot as plt

#generate some random data
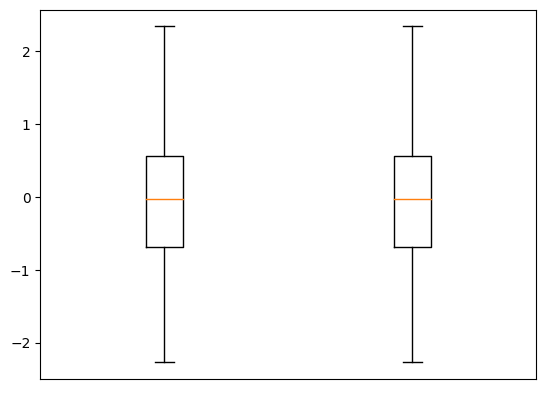
data = np.random.randn(200) ## 产生200个 标准正态分布数字,
d = [data, data] ### 两组一样的数字; list

#plot
box = plt.boxplot(d, showfliers=False) ## 画盒图

plt.xticks([])
plt.show()
#-----import packages-----#

#common python packages
import numpy as np
import matplotlib.pyplot as plt

#generate some random data
data1 = np.random.randn(10) ## 产生10个 标准正态分布数字,
data2 = np.random.randn(10)
data3 = np.random.randn(10)
data4 = np.random.randn(10)
data5 = np.random.randn(10)
d=np.vstack((data1,data2,data3,data4,data5))
print(d.shape)
print(d.ndim)

#plot
box = plt.boxplot(d, showfliers=False) ## 画盒图

plt.xticks([])
plt.show()
import matplotlib.pyplot as plt
import numpy as np
from matplotlib.patches import Polygon


# Fixing random state for reproducibility
np.random.seed(19680801)

# fake up some data
spread = np.random.rand(50) * 100
center = np.ones(25) * 50
flier_high = np.random.rand(10) * 100 + 100
flier_low = np.random.rand(10) * -100
data = np.concatenate((spread, center, flier_high, flier_low))

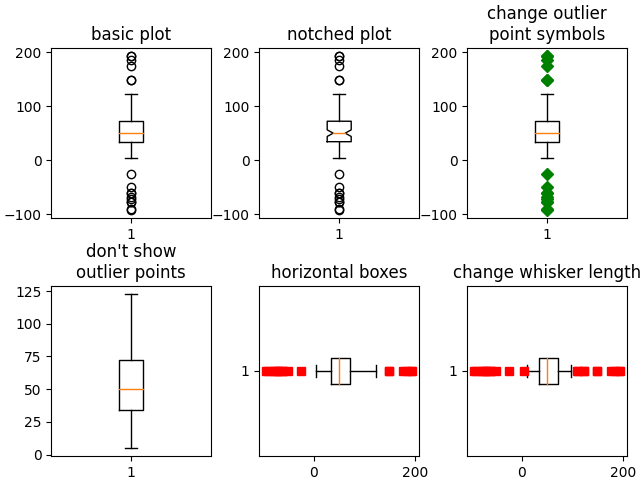
fig, axs = plt.subplots(2, 3)

# basic plot
axs[0, 0].boxplot(data)
axs[0, 0].set_title('basic plot')

# notched plot
axs[0, 1].boxplot(data, 1)
axs[0, 1].set_title('notched plot')

# change outlier point symbols
axs[0, 2].boxplot(data, 0, 'gD')
axs[0, 2].set_title('change outlier\npoint symbols')

# don't show outlier points
axs[1, 0].boxplot(data, 0, '')
axs[1, 0].set_title("don't show\noutlier points")

# horizontal boxes
axs[1, 1].boxplot(data, 0, 'rs', 0)
axs[1, 1].set_title('horizontal boxes')

# change whisker length
axs[1, 2].boxplot(data, 0, 'rs', 0, 0.75)
axs[1, 2].set_title('change whisker length')

fig.subplots_adjust(left=0.08, right=0.98, bottom=0.05, top=0.9,
                    hspace=0.4, wspace=0.3)

# fake up some more data
spread = np.random.rand(50) * 100
center = np.ones(25) * 40
flier_high = np.random.rand(10) * 100 + 100
flier_low = np.random.rand(10) * -100
d2 = np.concatenate((spread, center, flier_high, flier_low))
# Making a 2-D array only works if all the columns are the
# same length.  If they are not, then use a list instead.
# This is actually more efficient because boxplot converts
# a 2-D array into a list of vectors internally anyway.
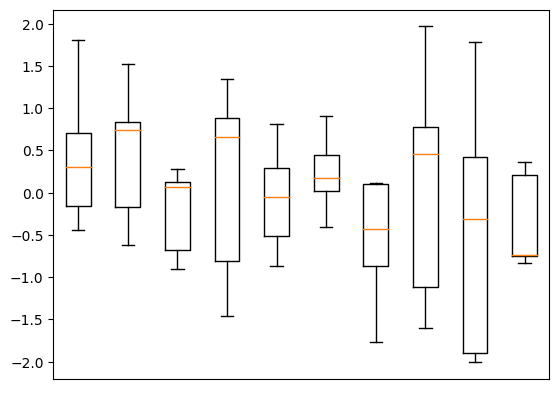
data = [data, d2, d2[::2]]

# Multiple box plots on one Axes
fig, ax = plt.subplots()
ax.boxplot(data)

plt.show()
