pybedtools Metaseq
https://blog.csdn.net/weixin_43569478/article/details/111602670
bedtools是区间操作最常用的软件,pybedtools对其进行了封装,可以在python编程环境中灵活使用bedtools,而且进一步拓展出了很多有用的功能。
在pybedtools中, 核心是以下两个对象
1. BedTool
2. feature
BedTools表示一个区间文件,支持BED, GTF, GFF, BAM等多种格式以及对应的压缩文件,feature表示文件的每一行,包含了染色体,起始,终止位置等相关属性和信息。
1. BedTool
构建BedTool对象的代码如下
bedtools这个软件相关的子命令,都在pybedtools中进行了实现,以取交集为例,对应的用法如下
取交集对应的函数为intersect, 对于bedtools子命令的相关选项,则以函数参数的形式封装在对应的函数中。
进行运算之后,结果可以通过如下两种方式来保存
saveas操作支持添加trackline, 在基因组浏览器中展示,而moveto方法只是简单的保存结果。本质上,pybedtools的运算结果,都以临时文件的形式存在,saveas相当于拷贝临时文件,生成新文件,moveto相当于重命名临时文件,速度更快。
在pybedtools中,大部分函数的返回结果都是BedTools对象,因此可以接受连缀写法,示例如下
与此同时,考虑到区间操作的特性,还进行了运算符重载,比如+号表示并集,-号表示差集,示例如下
2. feature
feature对象是文件中的一行,可以通过下标来访问,示例如下
对于feature中的每一列信息,可以通过数字下标,属性值,key这3种方式来访问,示例如下
feature还拥有fields属性,以列表的形式存储了对应的值,可以用于遍历操作,示例如下
对于feature而言,pybedtools提供了each和filter操作,进一步扩展其功能。filter操作则用于过滤行操作,过滤掉长度小于100feature的代码,示例如下
each操作对每一行进行遍历,主要用于统计一些新的指标;统计每个区间长度的代码,示例如下
以上只是pybedtools的基本用法
————————————————
链接:https://blog.csdn.net/weixin_43569478/article/details/111602670
metaseq.genomic_signal
Metaseq
Briefly, the goal of metaseq is to tie together lots of existing software into a framework for exploring genomic data. It focuses on flexibility and interactive exploration and plotting of disparate genomic data sets.
The main documentation for metaseq can be found at http://packages.python.org/metaseq/.
If you use metaseq in your work, please cite the following publication:
Dale, R. K., Matzat, L. H. & Lei, E. P. metaseq: a Python package for integrative genome-wide analysis reveals relationships between chromatin insulators and associated nuclear mRNA. Nucleic Acids Res. 42, 9158–9170 (2014). http://www.ncbi.nlm.nih.gov/pubmed/25063299
Example 1: Average ChIP-seq signal over promoters
Example 1 walks you through the creation of the following heatmap and line-plot figure:
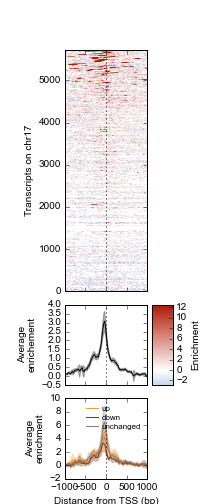
Top: Heatmap of ATF3 ChIP-seq signal over transcription start sites (TSS) on chr17 in human K562 cells. Middle: average ChIP enrichment over all TSSs +/- 1kb, with 95% CI band. Bottom: Integration with ATF3 knockdown RNA-seq results, showing differential enrichment over transcripts that went up, down, or were unchanged upon ATF3 knockdown.
Example 2: Differential expression scatterplots
Example 2 walks you through the creation of the following scatterplot and marginal histogram figure:
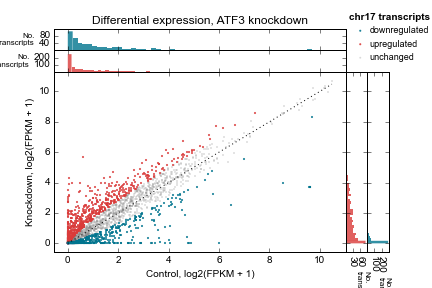
Control vs knockdown expression (log2(FPKM + 1)) for an ATF3 knockdown experiment. Each point represents one transcript on chromosome 17. Marginal distributions are shown on top and side. 1:1 line shown as a dotted line. Up- and downregulated genes determined by a simple 2-fold cutoff.
Other features
In addition, metaseq offers:
- A format-agnostic API for accessing “genomic signal” that allows you to work with BAM, BED, VCF, GTF, GFF, bigBed, and bigWig using the same API.
- Parallel data access from the file formats mentioned above
- “Mini-browsers”, zoomable and pannable Python-only figures that show genomic signal and gene models and are spawned by clicking on features of interest
- A wrapper around pandas.DataFrames to simplify the manipulation and plotting of tabular results data that contain gene information (like DESeq results tables)
- Integrates data keyed by genomic interval (think BAM or BED files) with data keyed by gene ID (e.g., Cufflinks or DESeq results tables)
Check out the full documentation for more.
Some use-cases for metaseq:
- Create NumPy arrays (which can be plotted as heatmaps) where each row represents a feature (say, TSS +/- 1kb) at fairly high speed. The actual speed is highly dependent on your data, but a rule of thumb is that it takes about 10s for every 10,000 2-kb features. Once you have the heatmap, you can sort, cluster, zoom, and pan to explore interesting groups. See the CTCF example for more on this as well as the metaseq.genomic_signal module.
- “Mini-browsers”. Instead of tweaking something, then laboriously converting to bedGraph, then bigWig, uploading your tracks to the genome browser, then searching for the region of interest, you can can just connect a mini-browser to your raw data and spawn figures locally. See the example_session for more on this as well as the metaseq.minibrowser API docs.
- Cluster genes based on the spatial distribution of ChIP-seq peaks around their TSSs.
- Scatter plot of DESeq results (basemeana vs basemeanb) where points are colored according to the number of ChIP peaks in the gene. This, too, can be attached to mini-browsers, enabling you to click on a point to see the genomic signal. See the metaseq.results_table module for more on this.
- Pie charts of where peaks fall within annotated genes – TSS, poly-A site, intron, exon, etc. See the metaseq.integration module for more on this.
Where possible, the inputs are standard formats – BED, GFF, GTF, BAM, SAM, DESeq results as saved from R, or even arbitrary tab-delimited data files that have a header. If you take the time to convert to bigWig or bigBed, performance will be improved.
Contents:
https://pythonhosted.org/metaseq/
https://pythonhosted.org/metaseq/
genomic_signal
The classes in this module enable random access to a variety of file formats (BAM, bigWig, bigBed, BED) using a uniform syntax, and allow you to compute coverage across many features in parallel or just a single feature.
Using classes in the metaseq.integration and metaseq.minibrowser modules, you can connect these objects to matplotlib figures that show a window into the data, making exploration easy and interactive.
Generally, the genomic_signal() function is all you need – just provide a filename and the format and it will take care of the rest, returning a genomic signal of the proper type.
Adding support for a new format is straightforward:
- Write a new adapter for the format in metaseq.filetype_adapters
- Subclass one of the existing classes below, setting the adapter attribute to be an instance of this new adapter
- Add the new class to the _registry dictionary to enable support for the file format.
Note that to support parallel processing and to avoid repeating code, these classes delegate their local_coverage methods to the metaseq.array_helpers._local_coverage() function.
https://pythonhosted.org/metaseq/autodocs.html#module-metaseq._genomic_signal

 浙公网安备 33010602011771号