STARR-seq
STARR-seq peak calling
STARRPeaker 输出文件的格式
Final Peak Call Format (up to v1.0; BED6+4)
- Column 1: Chromosome
- Column 2: Start position
- Column 3: End position
- Column 4: Name (peak rank based on score, 1 being the highest rank)
- Column 5: Score (integer value of "100 * fold change", maxed at 1000 per BED format specification)
- Column 6: Strand
- Column 7: Fold change (output/normalized-input)
- Column 8: Output fragment coverage
- Column 9: -log10 of P-value
- Column 10: -log10 of Q-value (Benjamini-Hochberg False Discovery Rate, FDR)
STARRPeaker uniform processing and accurate identification of STARR-seq active regions.docx
STARRPeaker 示例
chr1	737031	737531	peak_28774	292	.	2.917	113	2.999	1.862
chr1	779519	780068	peak_30539	286	.	2.859	151	3.421	2.181
chr1	851507	852190	peak_14391	369	.	3.691	136	4.882	3.371
chr1	882860	883360	peak_15546	359	.	3.589	203	5.654	4.034
chr1	943023	943523	peak_8220	453	.	4.534	129	3.701	2.399
chr1	983423	983986	peak_16365	352	.	3.522	225	4.083	2.707
chr1	1006435	1007050	peak_2367	733	.	7.331	392	10.014	7.957
chr1	1013140	1013640	peak_8504	448	.	4.481	221	6.173	4.488
chr1	1053795	1054295	peak_11463	400	.	4.004	289	4.051	2.681
chr1	1098488	1098988	peak_52307	237	.	2.372	135	2.783	1.707
https://hbctraining.github.io/Intro-to-ChIPseq/lessons/05_peak_calling_macs.html
_peaks.narrowPeak: BED6+4 format file which contains the peak locations together with peak summit, pvalue and qvaluemacs示例:
chr1	137988	139077	A001-K562.f3q10.sorted.dups_marked.macs_keep_dups_norm_peak_1	107	.	2.07609	12.79223	10.79328	800
chr1	183813	184198	A001-K562.f3q10.sorted.dups_marked.macs_keep_dups_norm_peak_2	62	.	1.80156	7.98671	6.25028	362
chr1 778328 779235 A001-K562.f3q10.sorted.dups_marked.macs_keep_dups_norm_peak_3 1000 . 4.02790 127.46170 123.78461 396
chr1	818721	819243	A001-K562.f3q10.sorted.dups_marked.macs_keep_dups_norm_peak_4	84	.	1.87128	10.32806	8.45139	341
chr1	826970	827885	A001-K562.f3q10.sorted.dups_marked.macs_keep_dups_norm_peak_5	268	.	2.54440	29.41094	26.89010	583
chr1	831880	832489	A001-K562.f3q10.sorted.dups_marked.macs_keep_dups_norm_peak_6	58	.	1.67430	7.58716	5.87863	200
chr1	842755	844744	A001-K562.f3q10.sorted.dups_marked.macs_keep_dups_norm_peak_7	122	.	1.98321	14.35260	12.28650	1394
chr1	851489	852108	A001-K562.f3q10.sorted.dups_marked.macs_keep_dups_norm_peak_8	27	.	1.52704	4.20449	2.78904	90
chr1	856307	856911	A001-K562.f3q10.sorted.dups_marked.macs_keep_dups_norm_peak_9	21	.	1.42146	3.44552	2.11941	202
chr1	860455	861134	A001-K562.f3q10.sorted.dups_marked.macs_keep_dups_norm_peak_10	50	.	1.67918	6.73655	5.08994	220

https://gander.wustl.edu/cgi-bin/hgTables?db=dm6&hgta_group=regulation&hgta_track=STARRseq_macs&hgta_table=S2_STARRseq_macs&hgta_doSchema=describe+table+schema
field example description chrom chr2L Reference sequence chromosome or scaffold chromStart 15790602 Pseudogene alignment start position chromEnd 15791396 Pseudogene alignment end position name dm6_S2_macs_peak_500 Name of pseudogene score 7 Score of pseudogene with gene (0-1000) strand . + or - or . for unknown thickStart 15790602 Start of where display should be thick (start codon) thickEnd 15791396 End of where display should be thick (stop codon) reserved 0 Always zero for now blockCount 3 Number of blocks blockSizes 1,726,1 Comma separated list of block sizes chromStarts 0,48,793 Start positions relative to chromStart signalValue 1.26549 Measurement of average enrichment for the region pValue 1.57219 Statistical significance of signal value (-log10). Set to -1 if not used. qValue 0.78136 Statistical significance with multiple-test correction applied (FDR). Set to -1 if not used.
chrom chromStart chromEnd name score strand thickStart thickEnd reserved blockCount blockSizes chromStarts signalValue pValue qValue chr2L 15790602 15791396 dm6_S2_macs_peak_500 7 . 15790602 15791396 0 3 1,726,1 0,48,793 1.26549 1.57219 0.78136 chr2L 15793470 15793982 dm6_S2_macs_peak_501 12 . 15793470 15793982 0 2 1,1 0,511 1.45984 2.08082 1.23422 chr2L 15877966 15879024 dm6_S2_macs_peak_502 12 . 15877966 15879024 0 2 1,1 0,1057 1.42725 2.06278 1.24344 chr2L 15892565 15893078 dm6_S2_macs_peak_503 7 . 15892565 15893078 0 2 1,1 0,512 1.32721 1.51711 0.73666 chr2L 15913711 15914639 dm6_S2_macs_peak_504 6 . 15913711 15914639 0 3 1,570,1 0,357,927 1.24213 1.39006 0.67120 chr2L 15921259 15923111 dm6_S2_macs_peak_505 20 . 15921259 15923111 0 3 1,688,1 0,27,1851 1.80132 2.93227 2.00504 chr2L 15934282 15935000 dm6_S2_macs_peak_506 9 . 15934282 15935000 0 3 1,664,1 0,49,717 1.39124 1.81636 0.95197 chr2L 15985186 15986307 dm6_S2_macs_peak_507 35 . 15985186 15986307 0 2 1,1 0,1120 2.22505 4.50524 3.53903 chr2L 16063228 16065183 dm6_S2_macs_peak_508 88 . 16063228 16065183 0 2 1,1 0,1954 3.77957 10.09229 8.80252 chr2L 16191197 16191985 dm6_S2_macs_peak_509 54 . 16191197 16191985 0 2 1,1 0,787 2.44281 6.54044 5.47299
STARR-seq:该方法是用来评估增强子(启动子)活性。
Epromoters: 指的是既可以作为promoters 同时可以作为远端基因的enhancers
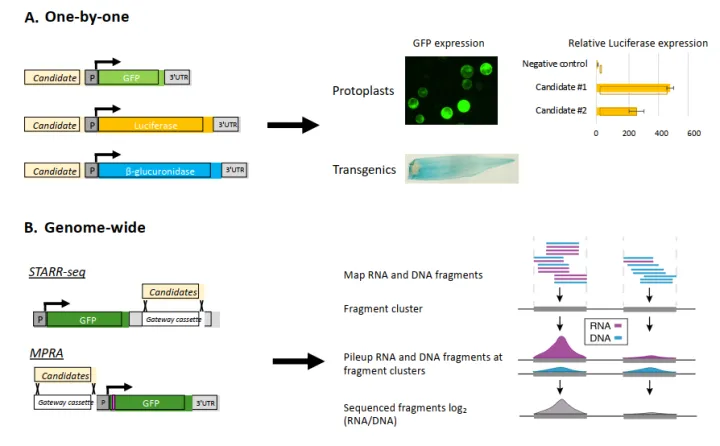
enhancers和epromoters的鉴定流程如下图:
主要是从GEO数据库搜集目前已发表的
STARR-seq和MPRA数据,然后分别进行Enhancer peak calling ,鉴定具有enhancers和Epromoters活性的序列。
链接:https://www.jianshu.com/p/98ce9a3f3fe5
STARR-seq目前广泛应用于增强子活性检测。但传统的STARR-seq的准确性严重依赖于从报告基因reporter gene启动子开始的自转录mRNA的完全恢复。
在质粒构建过程中,polyadenylation site(PAS)被添加到报告基因的后端,由于这个是设计好的PAS用来给自转录self-transcripts (STs) 做聚腺苷酸化polyadenylation 的,称之为“DPAS”。但是,可能存在alternative另外的 polyadenylation site(PAS)在检测DNA序列中,也是受到了enhancer的潜在影响,称之为“APAS”。APAS在STARR-seq中是不会被检测到的。
链接:https://www.jianshu.com/p/57d18d57d34f
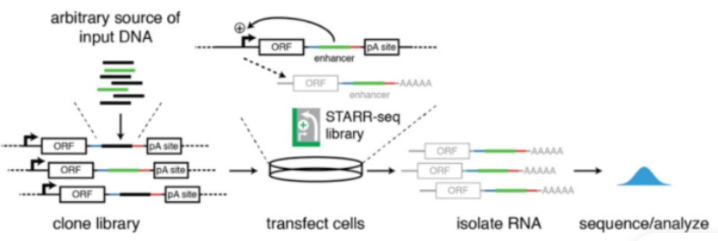
一种高通量的验证方法例如self-transcribing active regulatory region-sequencing(STARR-seq)能够对基因组范围内的CRMs进行大规模的评估。在STARR-seq中,基因组片段被打断并添加barcode,打断后的片段被克隆到报告基因的3’UTR区域,从而创建了一个报告基因库中衍生的RNA片段表明了CRMs的活性(图5B)。
https://zhuanlan.zhihu.com/p/440319953
https://news.sciencenet.cn/htmlpaper/2020/8/20208123422227357873.shtm
https://wenku.baidu.com/view/4ad853d4920ef12d2af90242a8956bec0975a5d4.html?_wkts_=1674140985734&bdQuery=starr-seq
https://www.science.org/doi/10.1126/science.1232542
Genome-Wide Quantitative Enhancer Activity Maps Identified by STARR-seq
SCIENCE17 Jan 2013Vol 339, Issue 6123pp. 1074-1077Abstract
Genomic enhancers are important regulators of gene expression, but their identification is a challenge, and methods depend on indirect measures of activity. We developed a method termed STARR-seq to directly and quantitatively assess enhancer activity for millions of candidates from arbitrary sources of DNA, which enables screens across entire genomes. When applied to the Drosophila genome, STARR-seq identifies thousands of cell type–specific enhancers across a broad continuum of strengths, links differential gene expression to differences in enhancer activity, and creates a genome-wide quantitative enhancer map. This map reveals the highly complex regulation of transcription, with several independent enhancers for both developmental regulators and ubiquitously expressed genes. STARR-seq can be used to identify and quantify enhancer activity in other eukaryotes, including humans.
Methodology[edit]
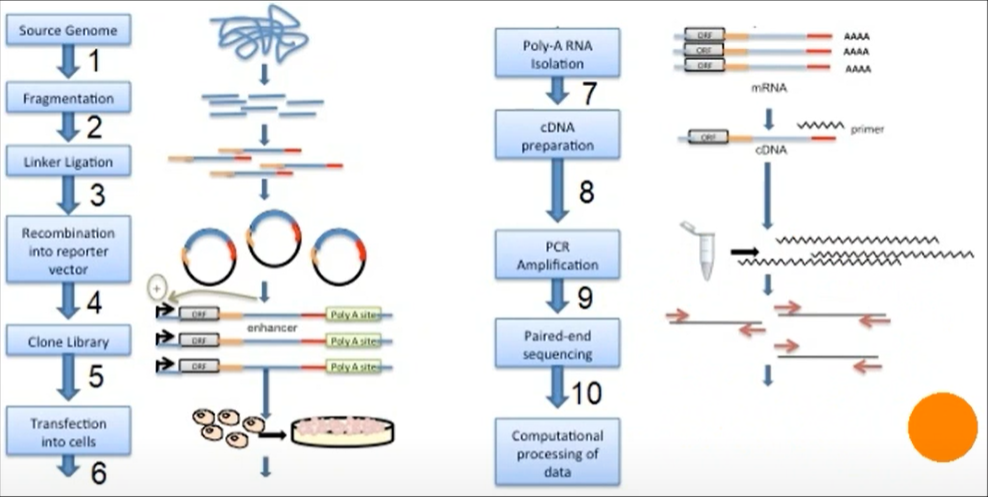
Genomic DNA is randomly sheared and broken down to small fragments. Adaptors are ligated to size-selected DNA fragments. Next, adaptor linked fragments are amplified and the PCR products are purified followed by placing candidate sequences downstream of a minimal promoter of screening vectors, giving them an opportunity to transcribe themselves. Candidate cells are then transfected with reporter library and cultured. Thereafter, total RNAs are extracted and poly-A RNAs isolated. Using reverse transcription method, cDNAs are produced, amplified and then candidate fragments are used for high-throughput paired end sequencing. Sequence reads are mapped to the reference genome and computational processing of data is carried out.[1]
https://www.sciencedirect.com/science/article/pii/S0888754315300100
https://en.wikipedia.org/wiki/STARR-seq
https://www.jianshu.com/p/98ce9a3f3fe5


 浙公网安备 33010602011771号