python matplotlib 绘图线条类型和颜色选择
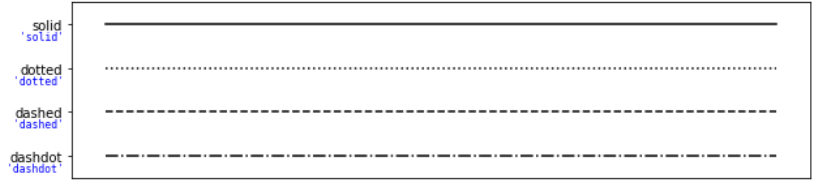
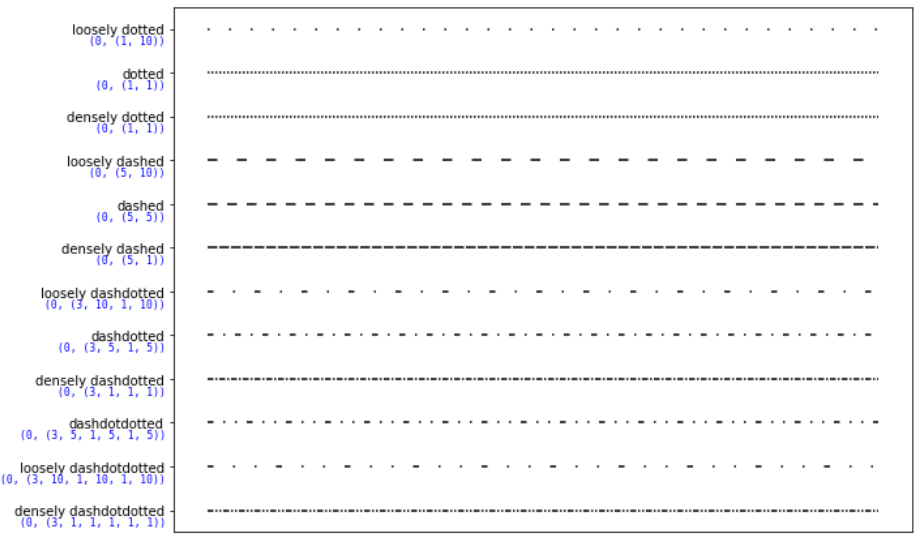
import numpy as np
import matplotlib.pyplot as plt

linestyle_str = [
     ('solid', 'solid'),      # Same as (0, ()) or '-'
     ('dotted', 'dotted'),    # Same as (0, (1, 1)) or '.'
     ('dashed', 'dashed'),    # Same as '--'
     ('dashdot', 'dashdot')]  # Same as '-.'

linestyle_tuple = [
     ('loosely dotted',        (0, (1, 10))),
     ('dotted',                (0, (1, 1))),
     ('densely dotted',        (0, (1, 1))),

     ('loosely dashed',        (0, (5, 10))),
     ('dashed',                (0, (5, 5))),
     ('densely dashed',        (0, (5, 1))),

     ('loosely dashdotted',    (0, (3, 10, 1, 10))),
     ('dashdotted',            (0, (3, 5, 1, 5))),
     ('densely dashdotted',    (0, (3, 1, 1, 1))),

     ('dashdotdotted',         (0, (3, 5, 1, 5, 1, 5))),
     ('loosely dashdotdotted', (0, (3, 10, 1, 10, 1, 10))),
     ('densely dashdotdotted', (0, (3, 1, 1, 1, 1, 1)))]


def plot_linestyles(ax, linestyles):
    X, Y = np.linspace(0, 100, 10), np.zeros(10)
    yticklabels = []

    for i, (name, linestyle) in enumerate(linestyles):
        ax.plot(X, Y+i, linestyle=linestyle, linewidth=1.5, color='black')
        yticklabels.append(name)

    ax.set(xticks=[], ylim=(-0.5, len(linestyles)-0.5),
           yticks=np.arange(len(linestyles)), yticklabels=yticklabels)

    # For each line style, add a text annotation with a small offset from
    # the reference point (0 in Axes coords, y tick value in Data coords).
    for i, (name, linestyle) in enumerate(linestyles):
        ax.annotate(repr(linestyle),
                    xy=(0.0, i), xycoords=ax.get_yaxis_transform(),
                    xytext=(-6, -12), textcoords='offset points',
                    color="blue", fontsize=8, ha="right", family="monospace")


fig, (ax0, ax1) = plt.subplots(2, 1, gridspec_kw={'height_ratios': [1, 3]},
                               figsize=(10, 8))

plot_linestyles(ax0, linestyle_str[::-1])
plot_linestyles(ax1, linestyle_tuple[::-1])

plt.tight_layout()
plt.show()
REF
https://matplotlib.org/3.1.0/gallery/lines_bars_and_markers/linestyles.html
The following format string characters are accepted to control the line style or marker:
| character | description |
|---|---|
'-' |
solid line style |
'--' |
dashed line style |
'-.' |
dash-dot line style |
':' |
dotted line style |
'.' |
point marker |
',' |
pixel marker |
'o' |
circle marker |
'v' |
triangle_down marker |
'^' |
triangle_up marker |
'<' |
triangle_left marker |
'>' |
triangle_right marker |
'1' |
tri_down marker |
'2' |
tri_up marker |
'3' |
tri_left marker |
'4' |
tri_right marker |
's' |
square marker |
'p' |
pentagon marker |
'*' |
star marker |
'h' |
hexagon1 marker |
'H' |
hexagon2 marker |
'+' |
plus marker |
'x' |
x marker |
'D' |
diamond marker |
'd' |
thin_diamond marker |
'|' |
vline marker |
'_' |
hline marker |
The following color abbreviations are supported:
| character | color |
|---|---|
| ‘b’ | blue |
| ‘g’ | green |
| ‘r’ | red |
| ‘c’ | cyan |
| ‘m’ | magenta |
| ‘y’ | yellow |
| ‘k’ | black |
| ‘w’ | white |
REF
good demos
https://matplotlib.org/2.1.1/api/_as_gen/matplotlib.pyplot.plot.html
All possible markers are defined here:
| marker | symbol | description |
|---|---|---|
"." |
 |
point |
"," |
 |
pixel |
"o" |
 |
circle |
"v" |
 |
triangle_down |
"^" |
 |
triangle_up |
"<" |
 |
triangle_left |
">" |
 |
triangle_right |
"1" |
 |
tri_down |
"2" |
 |
tri_up |
"3" |
 |
tri_left |
"4" |
 |
tri_right |
"8" |
 |
octagon |
"s" |
 |
square |
"p" |
 |
pentagon |
"P" |
 |
plus (filled) |
"*" |
 |
star |
"h" |
 |
hexagon1 |
"H" |
 |
hexagon2 |
"+" |
 |
plus |
"x" |
 |
x |
"X" |
 |
x (filled) |
"D" |
 |
diamond |
"d" |
 |
thin_diamond |
"|" |
 |
vline |
"_" |
 |
hline |
0 (TICKLEFT) |
 |
tickleft |
1 (TICKRIGHT) |
 |
tickright |
2 (TICKUP) |
 |
tickup |
3 (TICKDOWN) |
 |
tickdown |
4 (CARETLEFT) |
 |
caretleft |
5 (CARETRIGHT) |
 |
caretright |
6 (CARETUP) |
 |
caretup |
7 (CARETDOWN) |
 |
caretdown |
8 (CARETLEFTBASE) |
 |
caretleft (centered at base) |
9 (CARETRIGHTBASE) |
 |
caretright (centered at base) |
10 (CARETUPBASE) |
 |
caretup (centered at base) |
11 (CARETDOWNBASE) |
 |
caretdown (centered at base) |
"None", " " or "" |
nothing | |
'$...$' |
 |
Render the string using mathtext. E.g "$f$" for marker showing the letter f. |
verts |
A list of (x, y) pairs used for Path vertices. The center of the marker is located at (0,0) and the size is normalized, such that the created path is encapsulated inside the unit cell. | |
| path | A Path instance. |
|
(numsides, style, angle) |
The marker can also be a tuple
|
REF
https://matplotlib.org/3.1.0/api/markers_api.html
REF
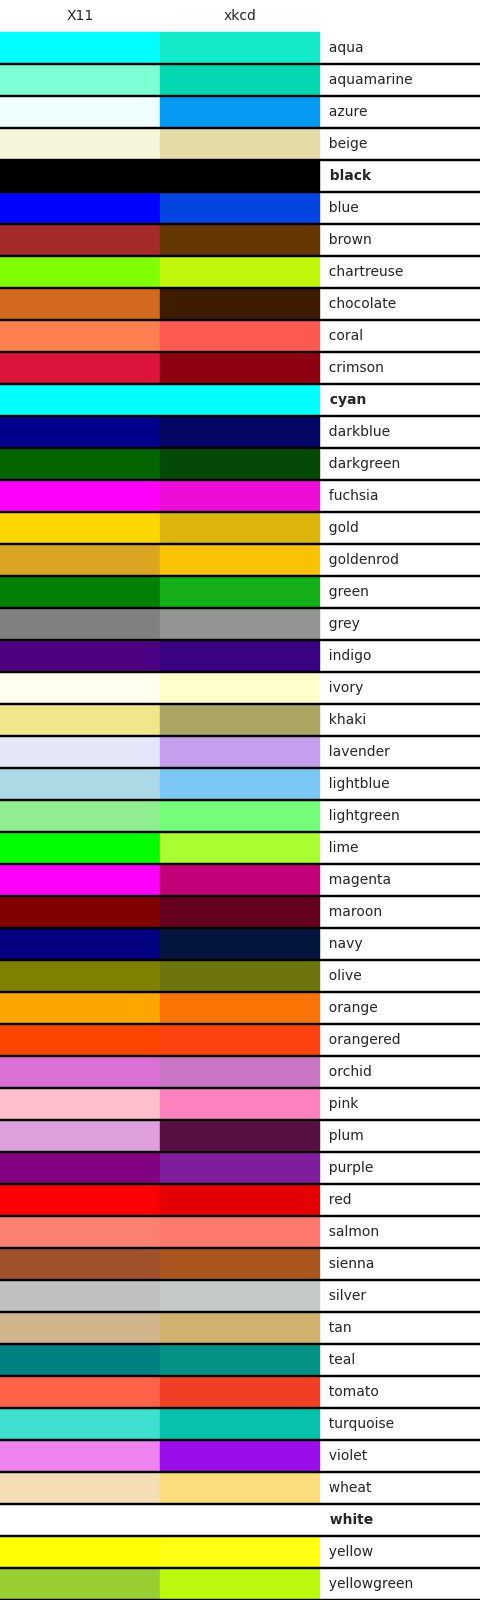
https://matplotlib.org/stable/tutorials/colors/colors.html
https://matplotlib.org/stable/gallery/color/named_colors.html

 浙公网安备 33010602011771号