Grafana数据可视化工具安装(监控zabbix数据)
一、Grafana介绍
Grafana是一个跨平台的开源的度量分析和可视化工具,可以通过将采集的数据查询然后可视化的展示,并及时通知。它主要有以下六大特点:
1、展示方式:快速灵活的客户端图表,面板插件有许多不同方式的可视化指标和日志,官方库中具有丰富的仪表盘插件,比如热图、折线图、图表等多种展示方式;
2、数据源:Graphite,InfluxDB,OpenTSDB,Prometheus,Elasticsearch,CloudWatch和KairosDB等;
3、通知提醒:以可视方式定义最重要指标的警报规则,Grafana将不断计算并发送通知,在数据达到阈值时通过Slack、PagerDuty等获得通知;
4、混合展示:在同一图表中混合使用不同的数据源,可以基于每个查询指定数据源,甚至自定义数据源;
5、注释:使用来自不同数据源的丰富事件注释图表,将鼠标悬停在事件上会显示完整的事件元数据和标记;
6、过滤器:Ad-hoc过滤器允许动态创建新的键/值过滤器,这些过滤器会自动应用于使用该数据源的所有查询。
二、下载
官网地址:https://grafana.com/grafana/download
选择对应系统的版本
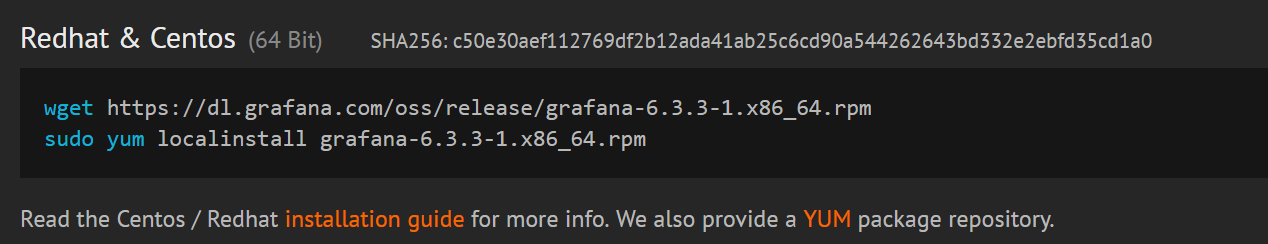
在监控服务器上执行下载安装包命令:
[root@centos6 ~]# wget https://dl.grafana.com/oss/release/grafana-6.3.3-1.x86_64.rpm
安装
[root@centos6 ~]# yum localinstall grafana-5.4.3-1.x86_64.rpm
三、启动
安装完成后启动服务:
[root@centos6 ~]# service grafana-server start
要安装一下grafana-zabbix插件,否则无法添加zabbix模板,获取插件列表,命令:
[root@centos6 ~]# grafana-cli plugins list-remote

[root@centos6 ~]# grafana-cli plugins list-remote|grep zabbix
id: alexanderzobnin-zabbix-app version: 3.10.4
安装alexanderzobnin-zabbix-app version: 3.10.4这个插件包:
[root@centos6 ~]# grafana-cli plugins install alexanderzobnin-zabbix-app
installing alexanderzobnin-zabbix-app @ 3.10.4
from url: https://grafana.com/api/plugins/alexanderzobnin-zabbix-app/versions/3.10.4/download
into: /var/lib/grafana/plugins

✔ Installed alexanderzobnin-zabbix-app successfully

Restart grafana after installing plugins . <service grafana-server restart>
26154/article/details/86654516
安装插件包后需要重启一次:
[root@centos6 ~]# service grafana-server restart
# centos 7
systemctl enable grafana-server.service
systemctl start grafana-server.service
启动服务,打开浏览器,输入IP+端口,3000为Grafana的默认侦听端口。
系统默认用户名和密码为admin/admin,第一次登陆系统会要求修改密码,修改密码后登陆,界面显示如下:
四、Grafana使用方法
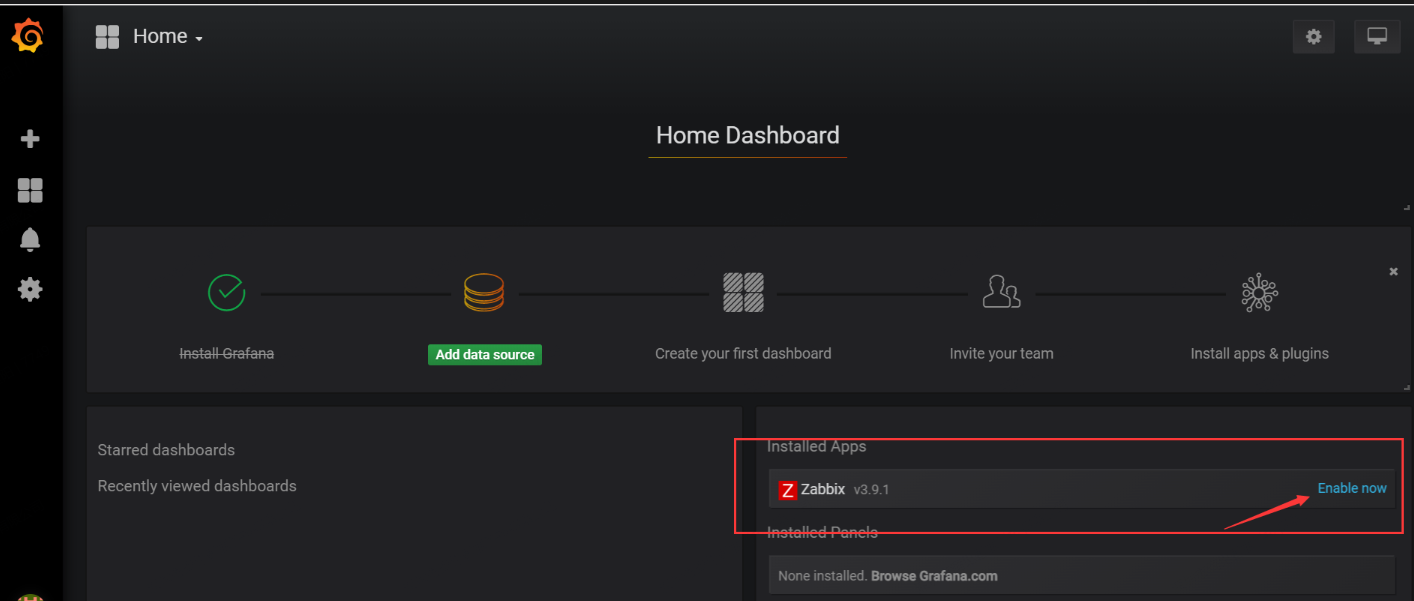
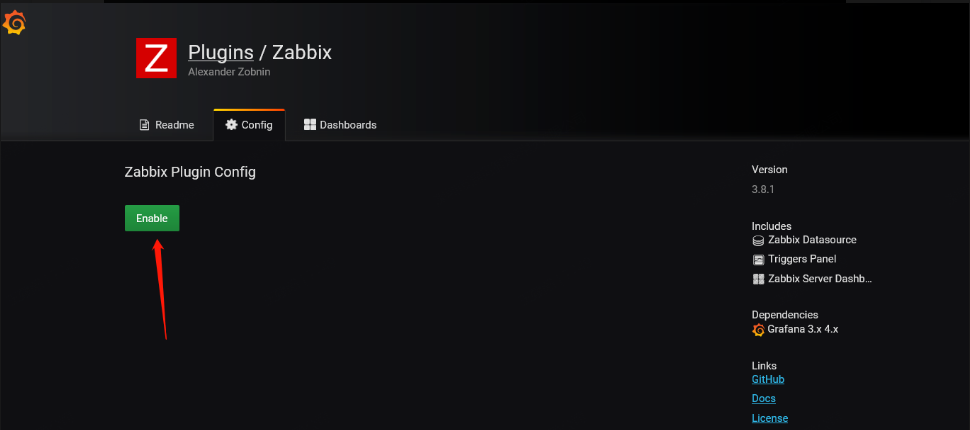
1.登录完成之后的界面,并点击红色箭头这里启用zabbix插件:
2.我们现在来创建zabbix-mysql数据库的连接,这步可选可不选,选择的好处是更快更省资源,不选的话,监控本身zbx-server 需要连接Direct DB Connection,用zabbix-api来通信。
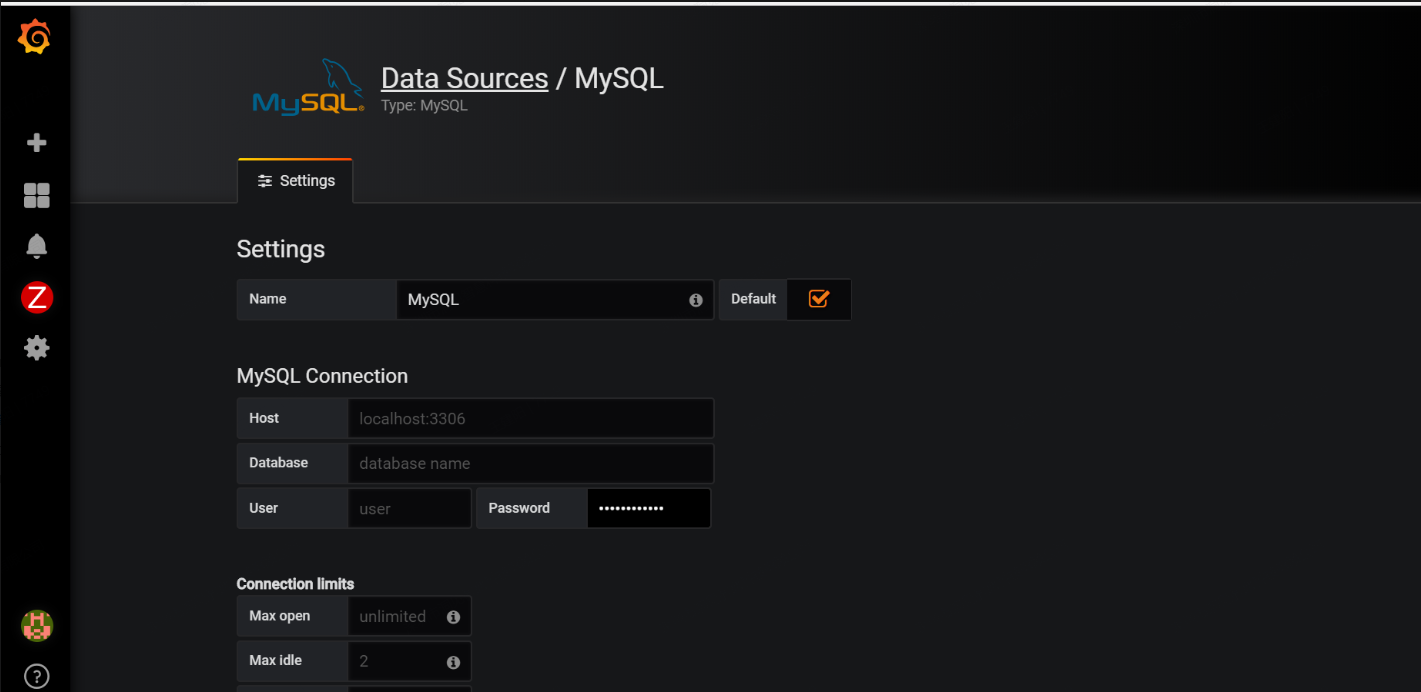
3.选择菜单"Configuration"-->"Data Source"-->"Add data source",配置示例如下
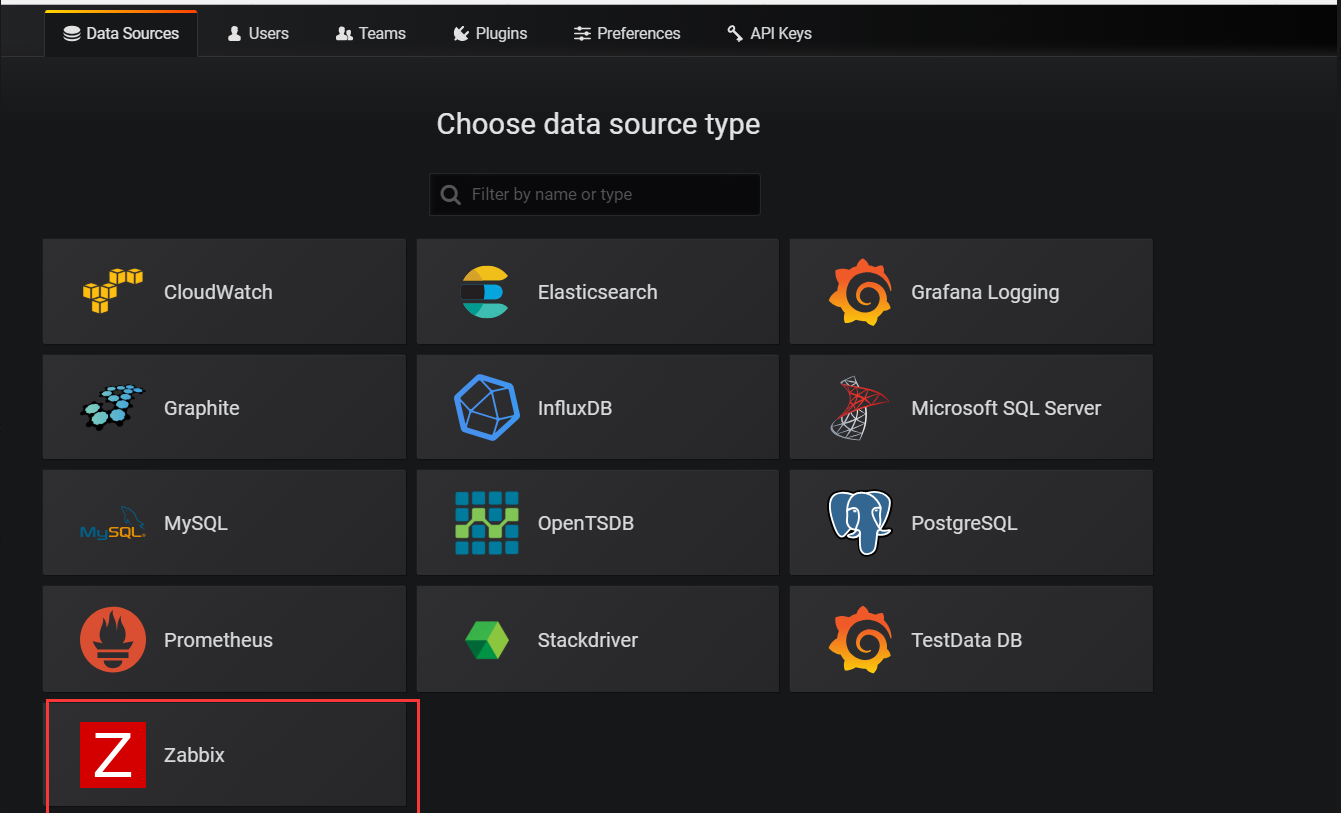
选择数据来源为zabbix。
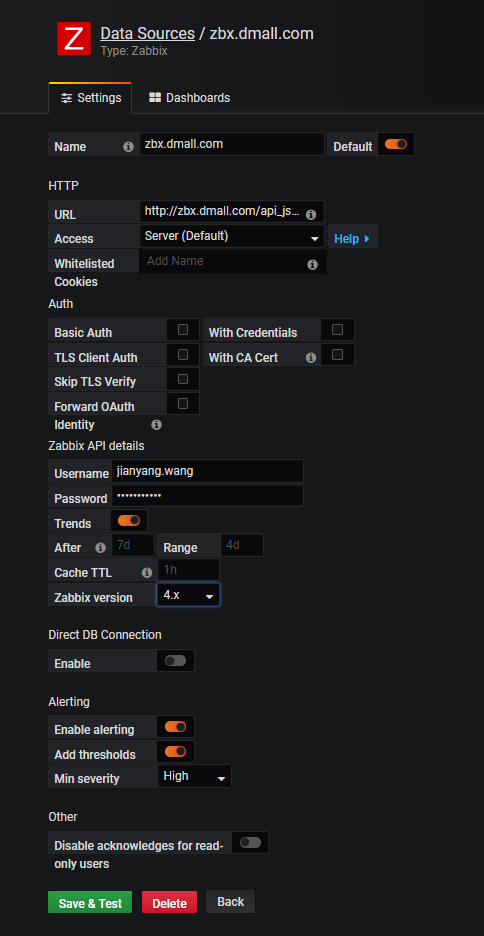
url要填写zabbix目录下的api_jsonrpc.php,格式为http://192.168.1.1/api_jsonrpc.php,下面的选项按实际情况填写,我的zabbix没有proxy,所以选默认的Server(default):
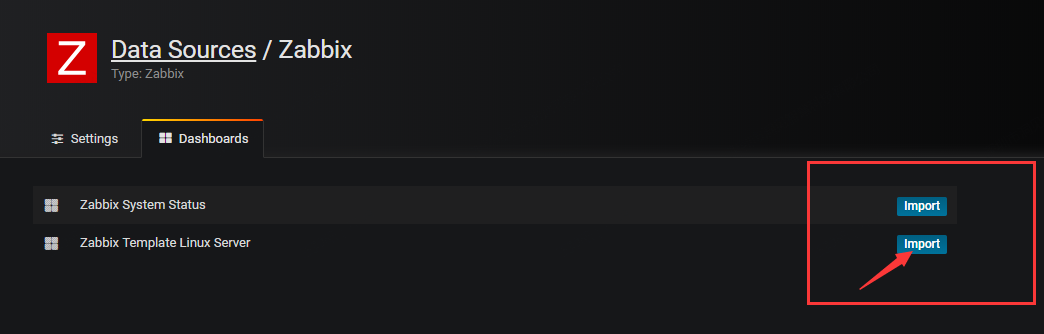
在Dashboards选项中可以选择默认的仪表盘:
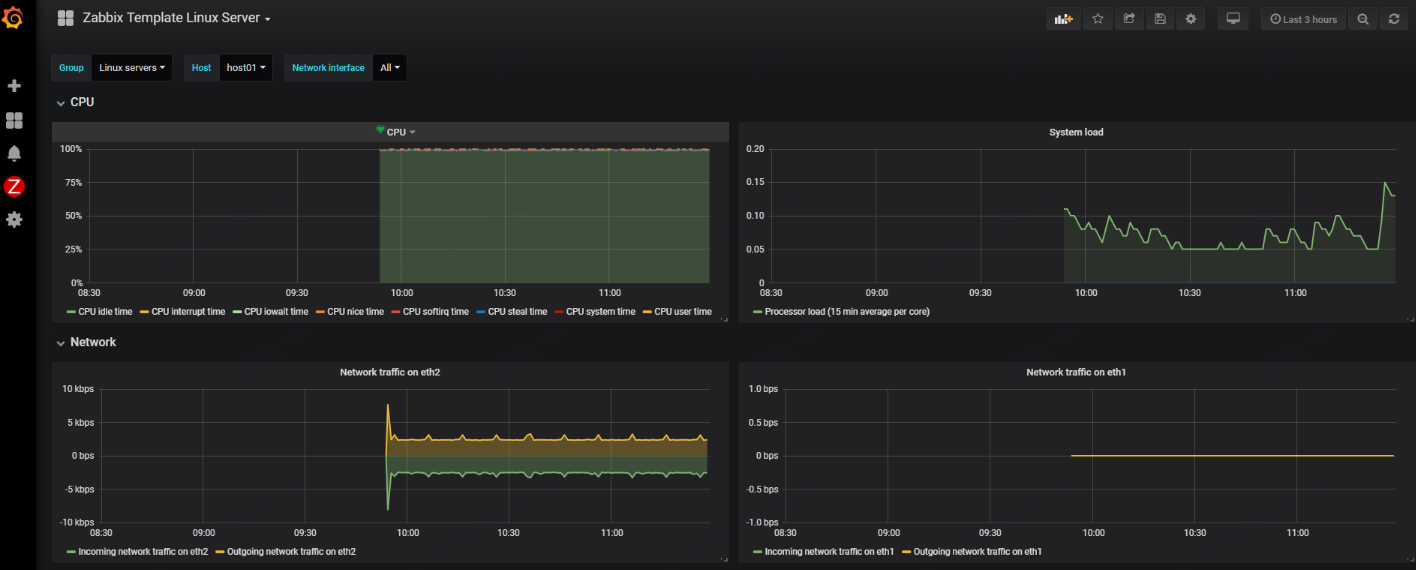
在左侧工具栏中的Dashboards选项中选择刚才的“Zabbix Template Linux Server”,就可以查看到获取到的zabbix数据:
本文来自博客园,作者:王竹笙,转载请注明原文链接:https://www.cnblogs.com/edeny/p/11416393.html

 浙公网安备 33010602011771号