LizRice--Learning EBPF
主要参考Liz Rice主讲的youtube视频:https://www.youtube.com/watch?v=TJgxjVTZtfw
这里做lab记录,持续更新ing
线上实验环境:https://play.instruqt.com/isovalent/invite/miht6dgdosp0/tracks/tutorial-getting-started-with-ebpf/电子书(需要公司邮箱认证)https://isovalent.com/books/learning-ebpf/
pdf版放留言百度链接
ebpf是什么,为什么很重要,能做什么
-
能让kernel可编程:它是在内核中运行自定义程序的能力,我们可以通过编写 eBPF 程序来改变内核的行为。
-
动态改变内核行为(为什么这个很重要):
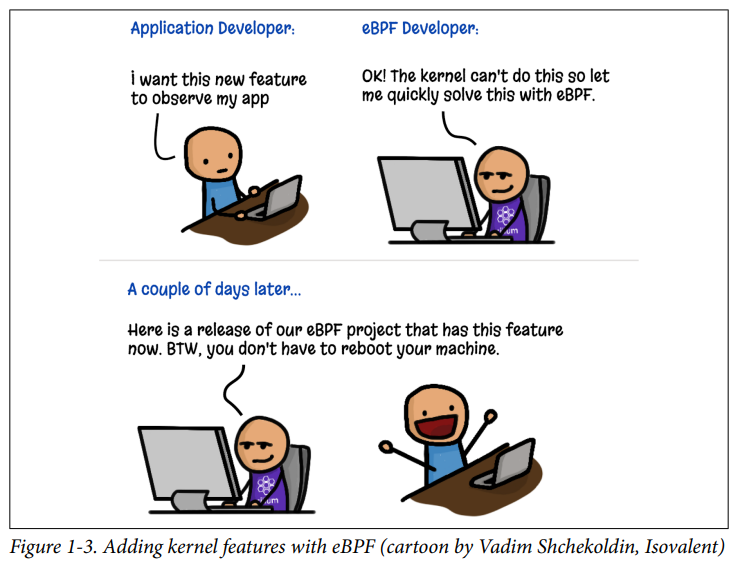
下面这个漫画,内核参与了计算机上我们所做的一切有趣的事情,无论是写入文件、从网络读取还是分配内存,所有这些都需要内核的帮助。而内核是不断发展的。但是如果你想要改变内核,首先你必须说服整个内核社区你的改变是一个好主意,然后你必须进行改变,内核中有数百万行代码,改变内核不是一件简单的事情,你必须说服每个人你的改变是一个好主意,即使你的补丁被内核接受了,也需要几年的时间,人们才会在生产环境中使用这个改变,因为人们在生产环境中通常不会使用最新的和最先进的内核,他们通常会使用三四五年前的内核。
所以,如果你想要改变内核的行为,你要么等很长时间,直到你和你的同事可以在生产环境中使用这个改变,要么你可以使用最新的内核,或者你可以编译自己的内核版本,但如果你想将这个改变分发给其他人,这是非常困难的工作,你需要长期投入其中。

而使用ebpf,我们可以编写一个程序,加载到内核中,甚至不需要重新启动机器,就可以改变内核的行为。这就是为什么这是一种具有重大意义的技术,因为内核参与了一切。
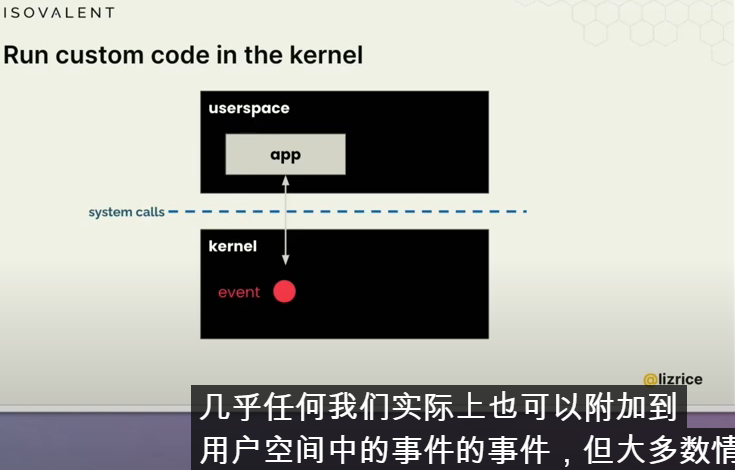
通常情况下,当我们编写应用程序代码时,我们是在用户空间中编写的,我们的应用程序通过系统调用向内核请求帮助。就像我之前提到的,任何涉及硬件的操作都需要内核的帮助。大多数应用程序开发人员并没有真正考虑系统调用,它都被抽象化了,你知道通常有某种我不知道打开的东西或用于打开文件的东西或打开套接字或向屏幕写入内容可能有某种打印命令,但所有这些东西在较低级别的下面并进行系统调用
虽然ebpf也可以附加到用户空间中,但我们更感兴趣的是将 ebpf 程序附加到内核中:任何函数调用、事件、perf事件、网络包到达堆栈中的任意一点
I'm kind of really interested in what we can do by attaching them to the kernel anything literally any function call any event any perf event any network packet Network packets arriving at various points in the stack can be used as events that we can attach to an ebpf program so whenever that event happens we'll see
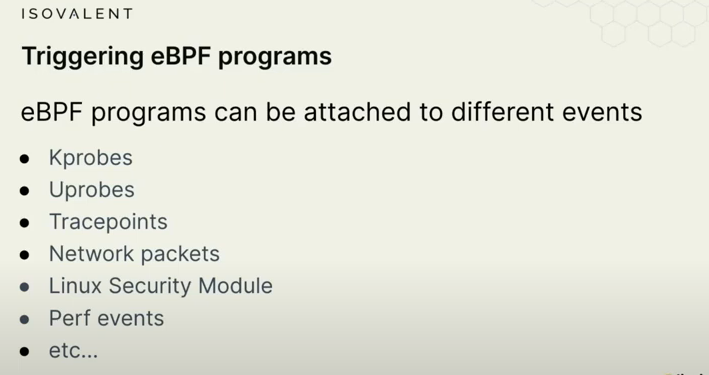
可以将ebpf附加到不同的event事件中,如以下这些:
- Kprobes和Uprobes是内核和用户空间中的探针,函数追踪点
- Linux安全模块API:App Armor或SE Linux;
ebpf和k8s关系
ebpf在k8s中很重要,在k8s中的可编程内核:

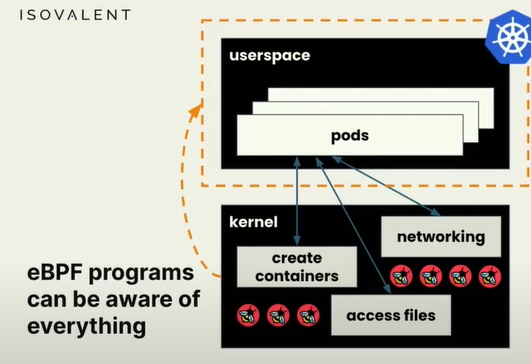
在K8s中我们在容器中运行应用代码,容器运行在Pod中,在虚拟机或裸机中运行很多Pod,但只有一个内核,所有容器都共享相同的内核,当它们想做有趣的事情时,都使用相同的内核,不论是网络还是访问文件,还是k8s想要创建一个新的容器,都需要内核帮助,因此kernel参与了所有事件。
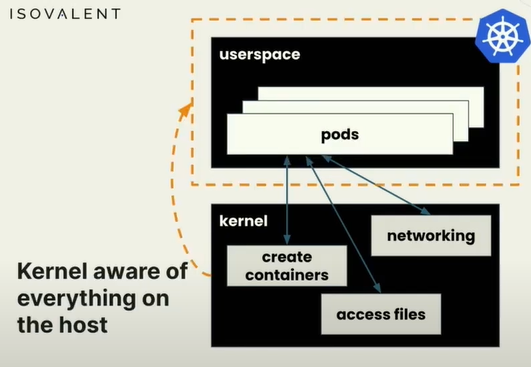
因此如果我们能够用ebpf在内核中监控,我们就能看到所有Pod中发生的情况,用它来潜在改变内核与这些Pod相关的行为方式,可以处于安全原因阻止某些事情,或影响系统中网络包的传递方式。
但是ebpf可以在内核中运行自定义程序,我们可以直接在内核中编写程序来改变内核的行为。这种能力是非常强大的,因为内核参与了一切,所以动态更改内核的行为是一件非常有趣和具有革命意义的事情。
这就是ebpf的基本介绍。现在我们可以开始进行实验室了,你们可以打开链接,进行实验,并在实验过程中遇到问题时,我们可以进行讨论和解答。我会再次发布链接,希望大家能够记住它。谢谢大家!
1-eBPF hello world
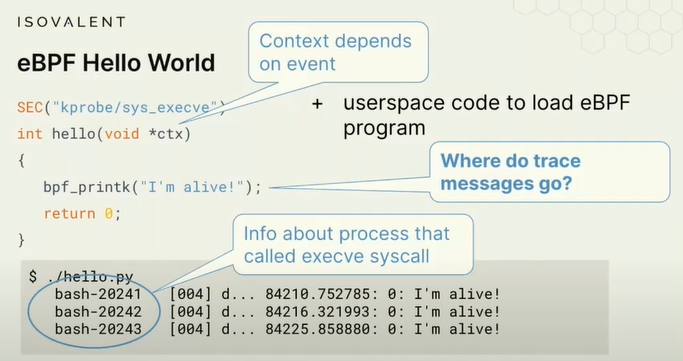
每次内核中调用execve时,就会触发hello world print执行,Context上下文信息取决于event事件
上下文参数:根据您附加程序的位置,可能会获得不同的上下文信息;上下文信息可能包括,首先导致此event事件的用户空间进程是什么,对于一个系统调用,用户空间进程必须进行这个系统调用。你也可以通过辅助函数获取有关进程的信息。实际上Kernel Tracing内核追踪给我们了一些信息,如可执行程序是什么,进程id、时间戳。
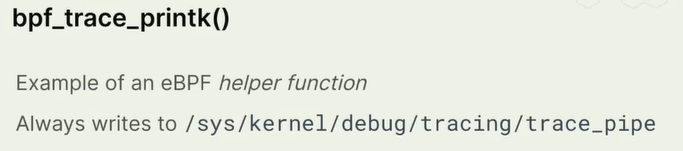
但是这样的追踪bpf_trace_printk()不是一个好方法,因为我们有很多很多的ebpf程序,例如每个网络接口都有一个ebpf程序,如果它们都将追踪信息转道这个单一的位置,这不是很有效的方法。
因此,我们使用称为eBPF Maps的东西。
This example is a Python program called
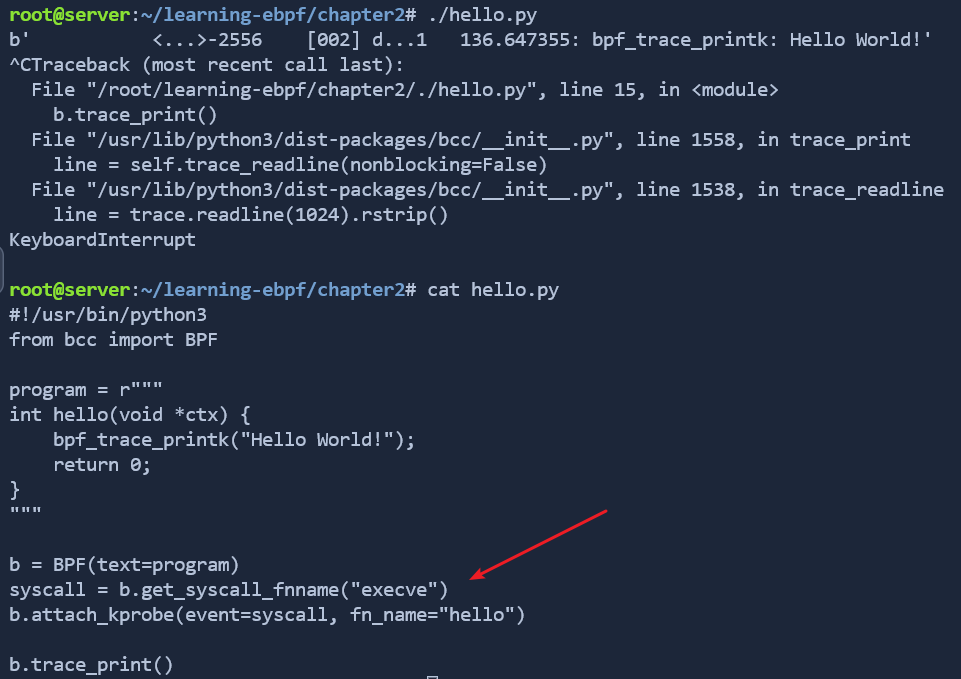
hello.py.cat hello.pyThe eBPF program that will run in the kernel is stored as a string in a variable called
program. The program looks like a C function calledhello(), and it simply writes a line of tracing before returning:int hello(void *ctx) { bpf_trace_printk("Hello World!"); return 0; }The rest of the file is Python code that compiles the eBPF program, loads it into the kernel, and attaches it to a kprobe that will be hit whenever the
execvesystem call runs. That system call is used to execute a program, so every time a new program runs on this virtual machine, thehello()eBPF program will get triggered.Run the program in the >_ Terminal 1 tab.
./hello.pySwitch to the >_ Terminal 2 tab, and execute a command (for example you could simply run
ls). If you switch back to the first terminal, you should see a line of trace has been generated.You might see additional lines of tracing that weren't triggered by you running a command. If anything else on this virtual machine makes the
execvesystem call, your eBPF program will be triggered. This is a great illustration of how eBPF programs can be used to detect things happening across the whole system.When you're done, use
Ctrl+Cto stop the program in >_ Terminal 1.Use the </> Editor tab to open the file
chapter2/hello.py.Edit the code to change the message that gets printed out to the screen, and save the file by clicking on the disk icon next to the file name near the top of the screen.
Run
hello.pyagain in >_ Terminal 1, and run some commands in >_ Terminal 2 to see your modified trace message being generated.Press
Nextto move on to the next task.
2-eBPF Maps
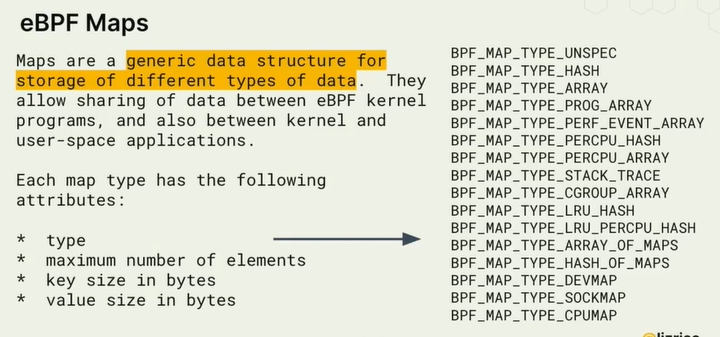
eBPF(Extended Berkeley Packet Filter)映射是一种数据结构,可以从内核中的 eBPF 程序和用户空间应用程序中进行访问。它们可以用于在 eBPF 程序和用户空间代码之间共享信息,例如将配置传递给 eBPF 程序,或将内核中收集的可观察性数据发送到用户空间。
有许多不同类型的BPF_MAP,多数都是哈希表,将有一个键值对,lab中将会看到。还有一些perf event性能事件、和更现代的事件不在这个表中。允许我们将事件信息流式传输到用户空间并以有效的方式获取信息。它们也是某种特殊用途的映射,
在接下来的视频中,我们将解释 eBPF 映射,然后继续下一个交互式实验。演示如何使用Map从内核空间(从ebpf程序)到用户空间传递信息。
代码:
In this section you'll learn about eBPF Maps, which can be used to pass data between eBPF programs and user space.
On the left side, you will see a tab >_ Terminal 1. In there, let's switch into our working directory.
cd learning-ebpf/chapter2/Take a look at the example code for this exercise (either by using
cat hello-map.pyor by opening the filechapter2/hello-map.pyin the </> Editor tab if you prefer):Using eBPF maps in BCC
The BCC framework provides macros that make it very easy to create maps. In this example the program creates a hash table, which stores key-value pairs, with this line:
BPF_HASH(counter_table);The keys will be user IDs, and the value is a counter that gets incremented whenever the eBPF program is run. Before we look at the eBPF program that will run in the kernel, let's examine how the user space code can access this map. If you look at the last few lines of the Python program, you'll see this code:
while True:
sleep(2)
s = ""
for k,v in b["counter_table"].items():
  s += f"ID {k.value}: {v.value}\t"
print(s)
This loops forever, sleeping for two seconds and then printing out all the key-value pairs in the
counter-tablemap. BCC makes it very easy to access the map from the user space code, by simply referring tob["counter_table"].Updating the map from the kernel
As in the previous "Hello World" example, the eBPF program that runs in the kernel is defined here as a string called
programthat BCC will compile and load into the kernel for us. The program is calledhello().The following line uses a BPF helper function to get the user ID under which the current process is running.
uid = bpf_get_current_uid_gid() & 0xFFFFFFFF;The helper function returns both the user and group ID, with the user ID in the lowest four bytes, which is why it needs to be ANDed with 0xFFFFFFFF to get just the user ID.
The next line performs a lookup in the
counter_tablemap to see if there is already an entry with the key that matches this user ID:p = counter_table.lookup(&uid);
pis a pointer to the value that corresponds to the key passed in, if there is one, and it will be null if there is no corresponding entry in the map. The eBPF verifier (which we'll discuss in more detail later) will complain if you try to dereference a null pointer, so there is an explicit check to make sure it is not null (0) before reading the current value into the variablecounter:if (p != 0) { counter = *p; }If there wasn't an entry for this user ID,
counterwill have its default value of 0 at this point. Whatever the current counter value is, it gets incremented, and then the key-value pair (uid-counter) gets written to the map.counter++; counter_table.update(&uid, &counter);Run the hello-map example
Let's run this program in >_ Terminal 1:
./hello-map.pySwitch to the >_ Terminal 2 tab, and execute commands such as
ls,psorwhoami.In the first terminal you'll start seeing output generated every two seconds.
Trace commands run by different user IDs
The output will be more interesting if
execvegets triggered by some different user IDs. There is a user calledlizalready defined in the sandbox, and you can switch to it with the commandsu liz. You could also define another user account of your own choosing withadduser. Acting as a different user, try running some commands and see how this generates different output in Terminal 1.You can use Ctrl-C to stop the program running.
Count all the syscalls
The eBPF program is currently attached to a kprobe for the syscall
execve, but with a small change you can instead attach it to a tracepoint that is called for every syscall that gets called on this virtual machine.Use the </> Editor tab to open
chapter2/hello-map.pyand:
- insert a
#character at the start of lines 25 and 26 so that the program doesn't get attached to theexecvekprobe- remove the
#at the start of line 29 so that the program does get attached to thesys_entertracepoint.To save your changes, click on the disk symbol next to the file name
hello-map.pynear the top of the screen.The program should look like this:
# syscall = b.get_syscall_fnname("execve") # b.attach_kprobe(event=syscall, fn_name="hello") # Attach to a tracepoint that gets hit for all syscalls b.attach_raw_tracepoint(tp="sys_enter", fn_name="hello")Running
./hello-map.pynow, you should see much higher counter values. You'll likely see some other user IDs that are active on the system too. You can useid -nu <user ID>if you're curious so see what those user IDs are!Go ahead and click Next for a quick quiz on Maps before we proceed with the next part of the tutorial.
#!/usr/bin/python3
from bcc import BPF
from time import sleep
program = r"""
BPF_HASH(counter_table);
int hello(void *ctx) {
u64 uid;
u64 counter = 0;
u64 *p;
uid = bpf_get_current_uid_gid() & 0xFFFFFFFF;
p = counter_table.lookup(&uid);
if (p != 0) {
counter = *p;
}
counter++;
counter_table.update(&uid, &counter);
return 0;
}
"""
b = BPF(text=program)
# syscall = b.get_syscall_fnname("execve")
# b.attach_kprobe(event=syscall, fn_name="hello")
# Attach to a tracepoint that gets hit for all syscalls
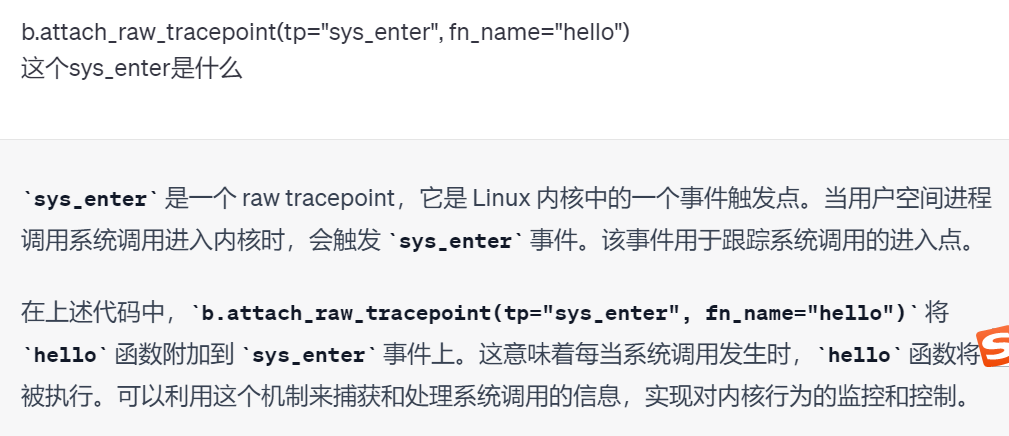
b.attach_raw_tracepoint(tp="sys_enter", fn_name="hello")
while True:
sleep(2)
s = ""
for k,v in b["counter_table"].items():
s += f"ID {k.value}: {v.value}\t"
print(s)
修改execve为sys_enter,两个调用方式也有不同
kprobe 和 raw tracepoint 是内核跟踪和调试的两种不同机制,它们具有一些区别。
kprobe 是一种动态跟踪机制,允许在内核函数的入口或出口处插入特定的函数(称为 probe 函数)进行监视和操作。它可以在函数执行前后进行处理,以便收集函数参数、修改参数值、记录函数执行时间等。在你的代码示例中,b.attach_kprobe(event=syscall, fn_name="hello") 将 hello 函数附加到 execve 系统调用的入口点上,当 execve 系统调用执行时,hello 函数将被调用。
相比之下,raw tracepoint 是一种静态跟踪机制,它提供了对内核中预定义的事件的访问权限。raw tracepoint 是内核中特定位置的标记点,当相关事件发生时,可以附加自定义函数进行处理。在你的代码示例中,b.attach_raw_tracepoint(tp="sys_enter", fn_name="hello") 将 hello 函数附加到 sys_enter 事件上,当任何系统调用进入内核时,hello 函数将被调用。
总的来说,kprobe 允许在函数级别进行更灵活的监视和操作,而 raw tracepoint 提供了对预定义事件的直接访问。选择使用哪种机制取决于你的具体需求和所要监视的内核行为。
BCC会将代码编译成ebpf对象文件,该对象包括ebpf字节码和ebpf映射
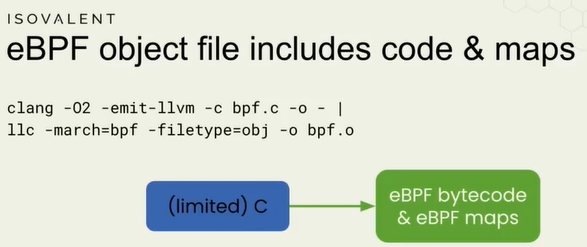
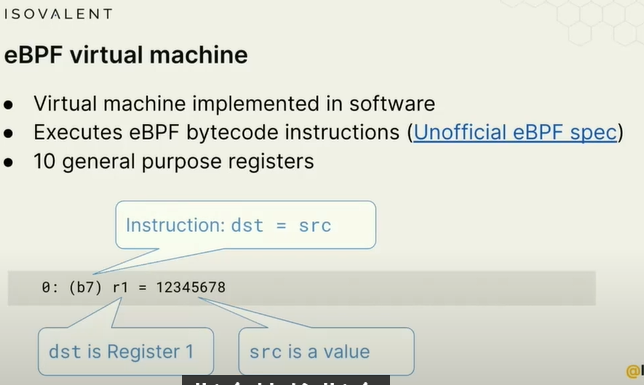
ebpf程序本质上像一个虚拟机,有指令集,看上去像机器码。对象文件由一组字节码指令组成(很像机器代码)。
ebpf实现了一个软件虚拟机,有10个通用寄存器,编号从0到9,但比x86机器码简单得多。类似,可以给寄存器分配一个值或者跳转、比较指令。
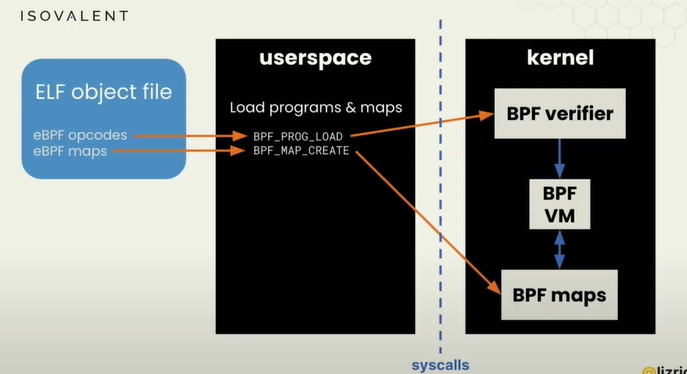
ebpf系统调用来加载(ebpf程序的)program和Map映射到内核中。内核会经过验证过程(BPF verifier稍后讨论)、BPF VM、BPF Maps。
BPF verifier是保证ebpf代码安全运行的机制,这也是ebpf程序和内核不同的地方,ebpf不会崩溃。
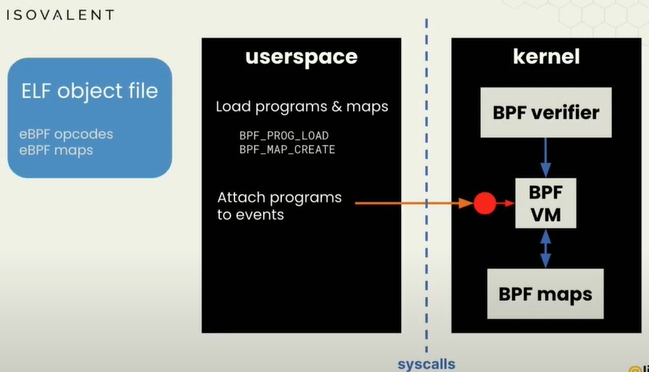
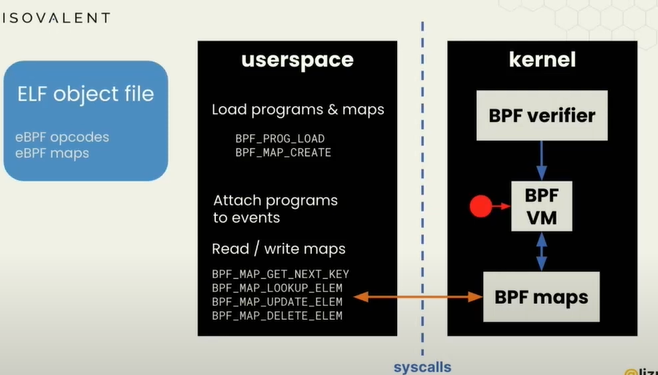
一旦您的ebpf程序加载到内核中,就会附加到一个event事件上,必须说出将触发该程序运行的事件是什么;然后我们使用系统调用从ebpf maps中获取用户空间的信息。
bpftool(Maps quiz、bpftool and bytecode/maps)
这个工具类似于操作ebpf程序和ebpf maps的瑞士军刀。
bpftool可以做的事情:可以执行很多系统调用,加载程序load programs,读取maps等
ebpf有参考文档嘛,目前ebpf.io 没有一个系统的参考文档
eBPF for networking

前面的例子都是ebpf可以附加到kprobe内核动态探针中,但也可以附加到网络堆栈中,我们有几个原因要这么做。
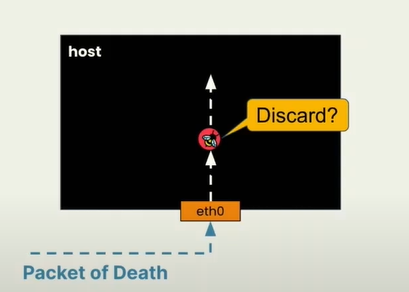
一个好的例子是,一个内核漏洞诱发原因是一个特别构造的网络包可以攻击内核,网络数据包有某种长度字段,如果将字段设为不合理的长度,内核传递数据包,可能会尝试无效访问某些内存或其他内容,然后崩溃。如果你是攻击者,你知道如何制作这些将内核崩溃的数据包(死亡数据包)。在过去没有ebpf时,需要修复该漏洞的方法就是升级内核版本并重启。但是有了ebpf之后,可以动态加载程序,可以检查网络数据包的格式,是否含有这些death数据,有的话就丢弃。好处是无需变更机器上运行的内容,无需升级内核就可以修复漏洞。
当然除了丢弃数据包还可以做修改、重定向数据包,创建cilium等有趣的事情。
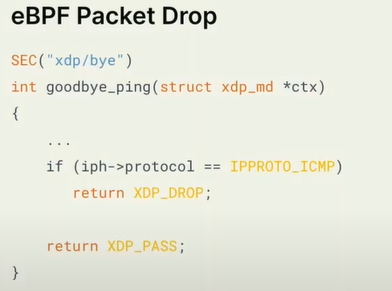
lab代码示例是对ping包的丢弃(icmp包)
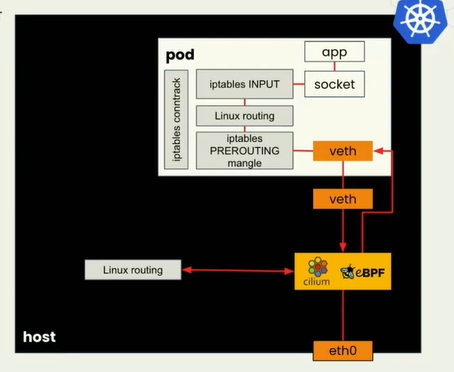
ciliums: 为什么ebpf对容器网络如此出色
原始的网络包传递过程中,需要从物理eth0网卡传入,经过各种路由转发、iptables等,根据IP找到虚拟机Pod的地址。由于集群中Pod是动态的,这一系列的操作很耗时。如果有ebpf可以省略中间很多过程。
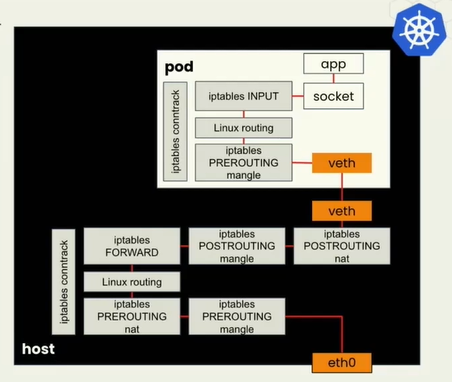
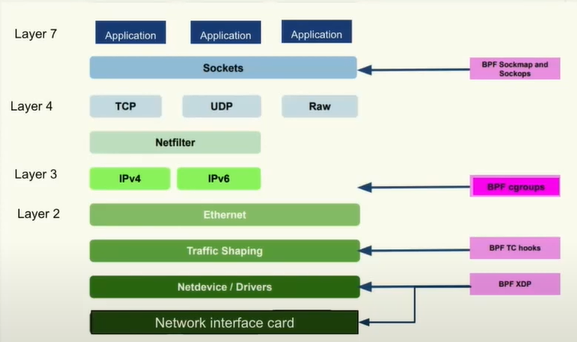
在network stack网络堆栈过程中,我们有很多地方可以进行挂载。下图的BPF cgroups(这没听懂)
这个网络传输堆栈中,可以挂载到应用接收前不同的点。只有不同的挂载效果和原因想要这样做。今天的例子是XDP(eXpress Data Path)
XDP program
想象一个数据包到达物理网络,在内核有机会对它做任何事情之前的地方,XDP hook就在这里。为什么它在内核操作之前?因为在网卡或驱动程序内部可以运行xdp程序,称为xdp offload。如果你有可以运行ebpf程序的网卡,就可以处理死亡数据包,防火墙,负载均衡等事情。这些数据包在网卡上就可以处理,甚至用不到去CPU的性能,因为它不需要内核处理。因此这和高性能网络一样。不是所有网卡都支持xdp offload,但是需要有这个概念理解。
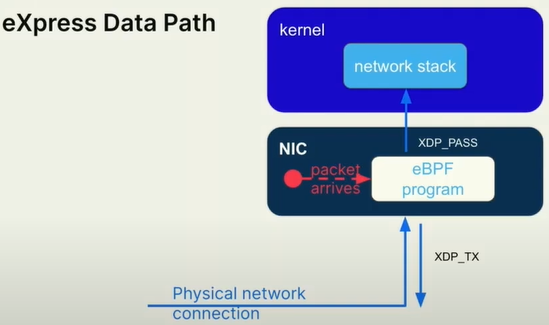
在实验中,XDP程序的返回值可以是XDP_PASS或XDP_DROP,用于指示内核如何处理网络数据包。
XDP_PASS表示将数据包继续传递给内核的后续处理阶段。这相当于告诉内核“按照你原来的方式继续处理这个数据包”,即不对数据包做任何修改或丢弃。XDP_DROP表示直接丢弃数据包,不进行后续处理。这相当于告诉内核“抛弃这个数据包,不再继续处理它”。
在XDP程序中,根据特定的条件和需求,可以选择返回XDP_PASS或XDP_DROP来控制数据包的流向。例如,如果某个数据包符合某种规则,你可以选择返回XDP_DROP来阻止其进一步传递或处理,或者选择返回XDP_PASS以允许数据包继续传递给内核的其他处理阶段。
这两种选项提供了在XDP程序中对网络数据包进行灵活处理的能力,使你能够实现自定义的数据包过滤、修改或丢弃策略。
ebpf verifier验证器
ebpf验证器(verifier)的功能和作用。
验证器是一个运行在eBPF程序上的组件,它分析eBPF字节码指令,并遍历程序中的每条可能路径。验证器的主要任务是跟踪每个寄存器中可能的值,并根据这些值来评估程序是否安全。
验证器会执行以下任务:
- 确保不会发生空指针解引用。因此,在对指针进行解引用之前,必须显式地检查指针是否为空。尽管在C语言中,解引用空指针是非法的,但编译器仍然能够编译通过,生成字节码。然而,在验证阶段,验证器会检查这一点,并拒绝通过未经检查的空指针解引用。
- 检查程序是否能够正常运行完成。验证器会分析程序的所有可能路径,并跟踪已处理的指令数量。如果指令数量超过一定限制(例如一百万),则验证器会认为程序可能无法正常运行完成,并拒绝通过验证。这个限制用于确保程序的复杂度在可控范围内,避免运行时间过长或进入无限循环等情况。
- 检查是否使用了适当的辅助函数(helper functions)。在eBPF中,有许多辅助函数可供使用,例如用于打印跟踪消息的辅助函数、用于获取当前运行进程信息的辅助函数、用于处理网络数据包的辅助函数等。验证器会检查程序是否正确使用了这些辅助函数,以确保程序的正确性和安全性。

 浙公网安备 33010602011771号