GWAS基础(一)
定义:
A GWAS quantifies statistical association between genetic variation and phenotypes.
用途:
1)can point to biological mechanisms affecting the phenotype(预测表型相关突变),
2)can allow prediction of the phenotype from genomic information(通过突变预测表型).
应用领域:
Medicine (遗传和环境造成的有害变异);
Biotechnology (更有效地改进、使用动植物、微生物资源;
Forensics (法医鉴定);
Ancestry inference (祖先推断),
Understanding the role of natural selection and evolutionary forces.
最重要的特性:
稳定,个体的基因组几乎终生不变(不像代谢组、宏基因组、转录组、蛋白组和表观组),是一个作为研究起点的理想选择。
伦理问题:个体基因组学数据的隐私和使用问题。
1.1 Genetic variation
要点1:我们每个人都携带两套细胞核基因组(父母)和线粒体基因组(母亲);
要点2:Human genome is 3.2 billion nucleotides (or base pairs or DNA letters A, C, G, T);
要点3:Protein coding genes covers <2% of the whole human genome, but the remaning 98% affects the regulation of genes in many ways;
要点4:Locus (pl. loci), A continuous region of the genome is called a locus. It can be of any size (e.g. a single nucleotide site of length 1bp or a region of 10 milion base pairs, 10Mbp).
1.1.1 Gentic variants
要点1:A one-nucleotide variation is called a single-nucleotide variant (SNV) and the two versions are called alleles;
要点2:The minor allele frequency (MAF) is >1% in the population, the variant is called a polymorphism, single-nucleotide polymorphism (SNP);
要点3:We consider SNPs as the canonical type of genetic variation. Typically, the SNPs are biallelic, i.e., there are only two alleles present in the population. In principle, however, all four possible alleles of a SNP could be present in the population;
要点4:Ambiguous SNPs;
要点5:genetic variation数据库:
1.The Human Genome Project, 1990-2003 established a first draft of a human genome sequence;
2. The HapMap project, 2002-2009 studied the correlation structure of the common SNPs;
3. The 1000 Genomes project, 2008-2015, expanded HapMap to genome sequence information across theglobe and currently remains a widely-used reference for global allele frequency information;
4. Exome Aggregation Consortium (ExAC), 2014-2016 concentrated only on the protein coding parts ofthe genome, so called exons, that make up less than 2% of the genome and was able to provide accuratesequence data for the exomes of over 60,000 individuals;
5. Genome Aggregation Database (gnomAD), is expanding the ExAC database and also includes additionalwhole genome sequencing information. It is the current state-of-the-art among the public genomevariation databases.
1.1.2 Genotype and Hardy-Weinberg equilibrium
SNP in the population
要点1:Each snp has two alleles. We name the alleles in such a way that the minor allele (the one that is less common in the population) is called allele 1. The major allele (the one that is more common in the population) is called allele 0.
要点2:denote MAF f, 每个人有两套基因组,个体的基因性有三种可能AA((1-f)2),Aa(2f(1-f))和aa(f2)。该频率就叫做哈迪温伯格平衡频率。根据f,可以确定理想的随机交配群体里面的理论平衡频率。在实际应用中,人群的大多数variants符合HWE。HWE在质控中应用比较多,用来去除不符合HWE的variants。
要点3:HWE test,理论分布与实际分布的比较,Pearson’s Chi-squared test,chisq.test(rbind(counts.from.geno,counts.from.hwe))


原假设:位点的频率符合HWE
备择假设:位点的频率不符合HWE
1.2 What is a genome-wide association study?
GWAS研究,大致有两类,一类是数量性状(Quatitive trait)GWAS,另一类是case-control GWAS(Disease居多);
Monogenic表型,单基因表型;
Oligogenic表型,<=2基因决定的表型;
Polygenic表型,>=3基因决定的表型;
Complex trait,>=3个基因+环境影响的表型;
Common disease,>0.1%的患病率的疾病;
Common variant,>1% or 5%的突变位点;
Low-frequency variant, <0.1%;
Rare variant,频率<Low-frequency variant。
1.2.1 Quantitative traits
要点1:给定基因频率。模拟基因性频率:rbinom(n, size = 2, p = f) #genotypes for ’n’ individuals assuming HWE。
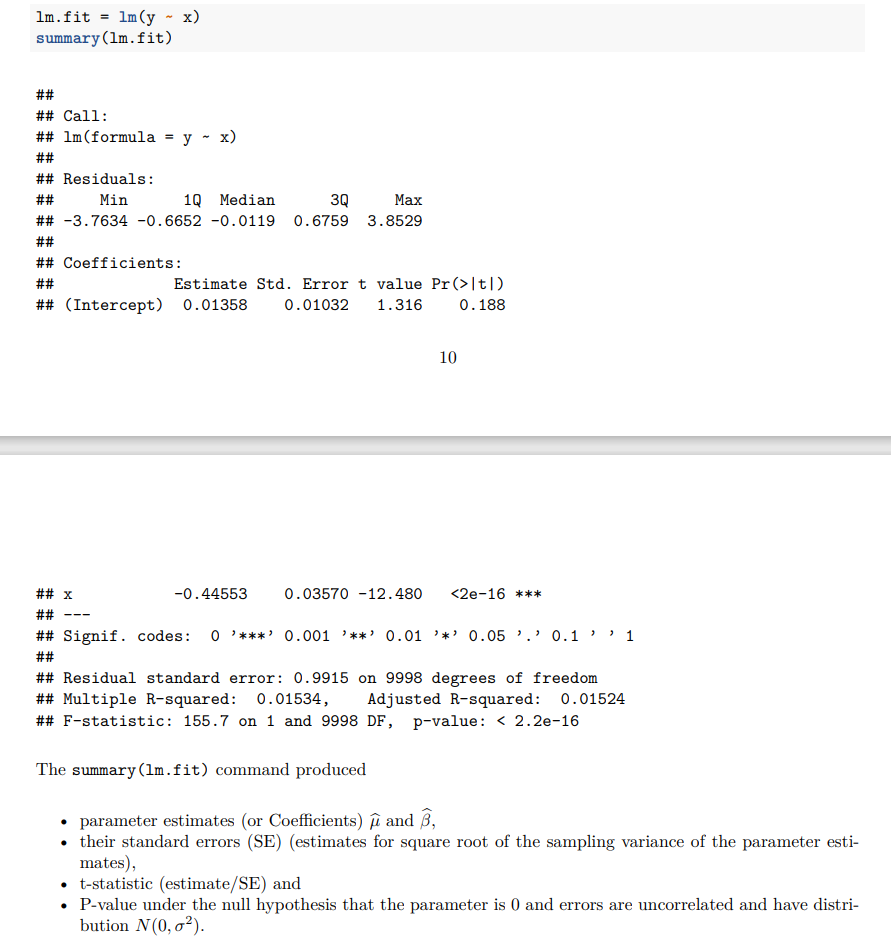
要点2:Additive model,分析基因性和表型关联的最简单方法,它假设每个group的均值取决于allele 1在基因型中的数量,不同基因型的SD是恒定的。因此,将基因型和表型的关联用线性模型表示:y = µ+xβ +ε,y是表型,x是基因型。其中需要估计的参数是µ(the mean of genotype 0)和β (the effect of each copy of allele 1 on the mean phenotype)。

要点3:GWAS中,因为样本量足够大,经常默认使用z-score和正态分布代替t-statistic和t分布。
要点4:RSS(residual sum of squares),模型(估计的参数)不可解释多少y的方差。

R^2是可解释y方差的比例。

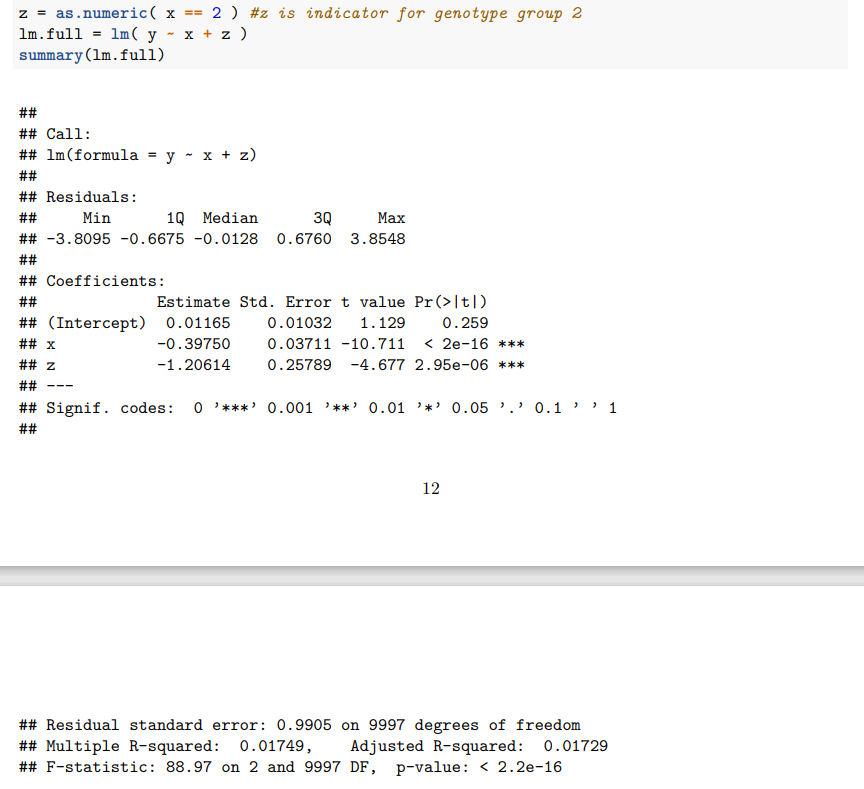
要点5:Full model,增加了一个参数γ 来描述group 2的残差效应。y = µ + xβ + zγ + ε, where z is indicator of genotype 2,i.e., zi = 1 if individual i has genotype 2 and otherwise zi = 0.在这个full model里面,每个基因型都有其自己的均值(genotype 0: µ; genotype 1: µ + β and genotype 2: µ + 2β + γ)。

要点6:Additive model(较full model) 使用最广泛,现在的观点认为additive model比full model更powerful。此外经常使用Quantile normalisation来标准化表型,减少异常值、便于不同cohorts之间的比较。
1.2.2 Binary phenotypes
要点1:Relative risk and odds ratio

λ1表示个体基因型是genotype1时患病风险/个体基因性是genotype0时患病风险
λ1=1,该基因型与表型无关;
λ1>1,该基因型引起表型;
λ1<1,该基因型对表型起保护作用。
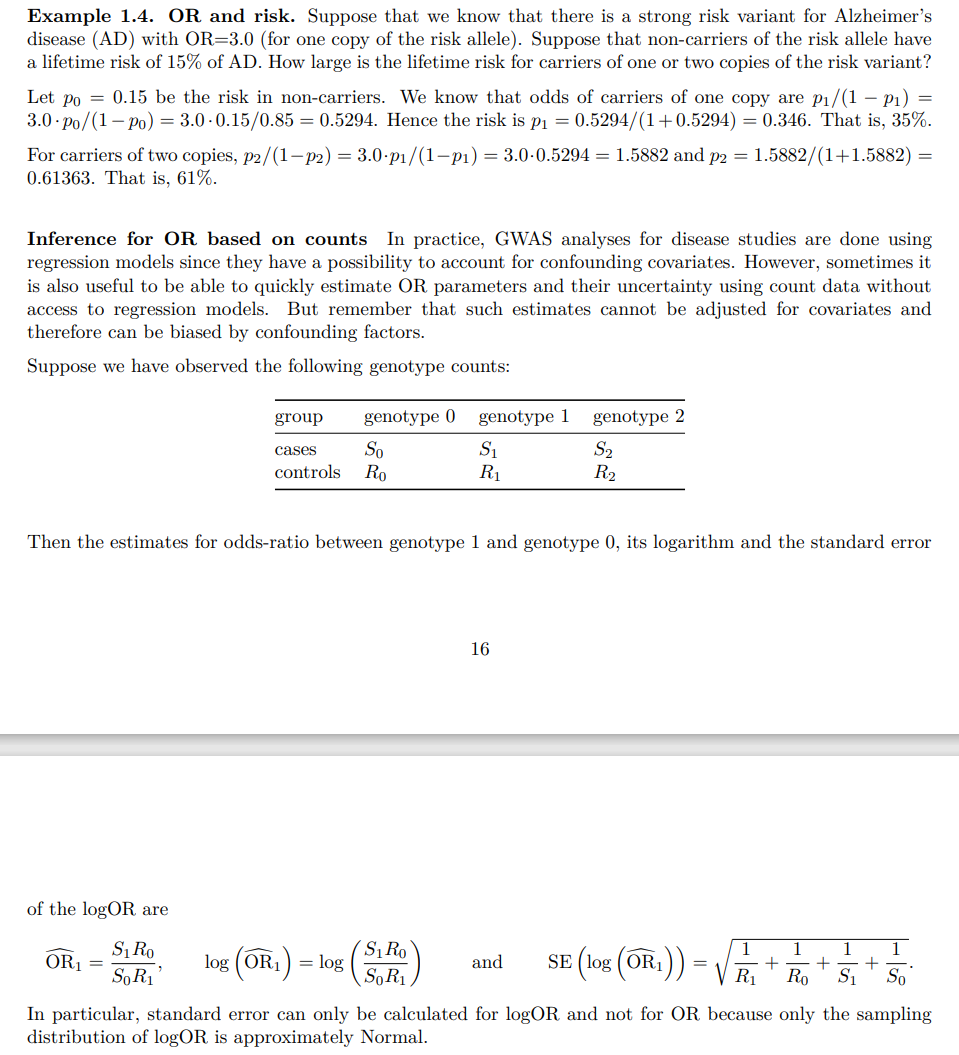
odds ratio (OR): measure the the relative increase in risk between two genotypes.


我们在GWAS summary文件里面看到的SE都是log(OR)的SE。 要点2:在binary traits研究中,用Logistic regression不用线性回归。研究的不再是性状和基因型的关联,而是患病风险和基因型的关联:

µ is the logarithm of odds (‘log-odds’) for genotype 0 and β is the log of odds ratio (logOR) betweengenotype 1 and 0 (and exp(β) is the corresponding odds ratio). Similarly 2β is the logOR between genotypes2 and 0.
注:本文是赫尔辛基大学Matti Pirinen教授讲授GWAS课程(https://www.mv.helsinki.fi/home/mjxpirin/GWAS_course/) 的学习笔记。


