mysql 使用Show Profile进行sql分析 ,全局查询日志(argument为0x)
show profile:
查看是否开启功能
show variables like 'profiling';
开启功能
set profiling=on;
查询数据库(运行查询sql语句)
。。。。
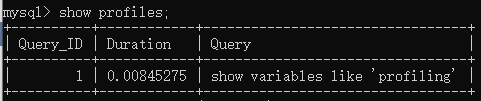
查看profiles
show profiles;
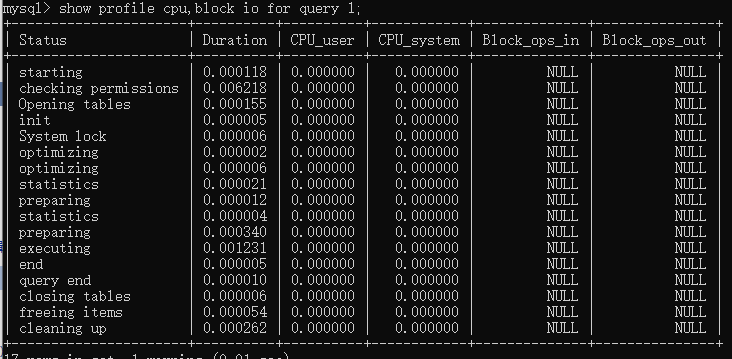
查看一号查询语句的cpu,io使用情况(query 后面就是上面的query_id对应的第几行sql语句)
show profile cpu,block io for query 1;
参数类型:

sql中可能有的问题(status):

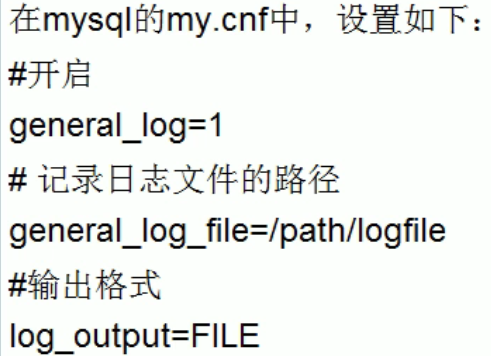
全局查询日志:
用于测试复现故障,永远不要在生产环境下开启这个功能
代码启用:
set global general_log=1;
set global log_output='TABLE';
查看日志
select * from mysql.general_log;
在mysql8中argument使用0x

可以修改日志中argument的格式
alter table mysql.general_log modify column argument varchar(100) not null;
设置输出类型为 table(保存在)
set global log_output='table';
设置输出类型为file
set global log_output='file';
查看日志是否开启
show variables like 'general_log';
开启日志功能
set global general_log=on;
查看日志文件保存位置
show variables like 'general_log_file';
设置日志文件保存位置
set global general_log_file='/tmp/mysql_general.log';
查看日志输出类型 table或file
show variables like 'log_output';
配置启用:

 浙公网安备 33010602011771号