echarts折线图
折线图
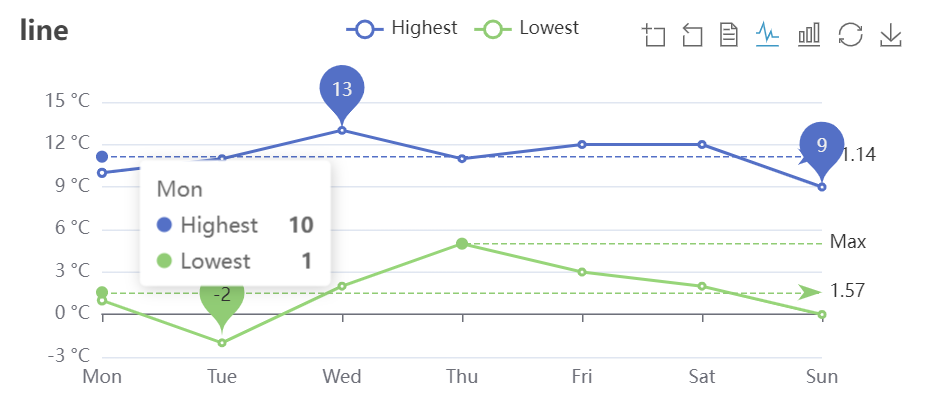
<!DOCTYPE html>
<html lang="en">
<head>
    <meta charset="UTF-8">
    <title>折线图</title>
</head>
<body>
<!--第一步:引入echarts-->
<script src="js/echarts.js"></script>

<!--第二步:html DOM 中准备一个div,之后用于渲染echarts图表-->
<div id="main" style="width:600px;height:300px;"></div>

<script>
    /*echarts标签化引入*/
    var myChart = echarts.init(document.getElementById('main'));
    /*配置项*/
    var option = {
        title: {
            text: 'line'
        },
        tooltip: {
            trigger: 'axis'
        },
        legend: {},
        toolbox: {
            show: true,
            feature: {
                dataZoom: {
                    yAxisIndex: 'none'
                },
                dataView: { readOnly: false },
                magicType: { type: ['line', 'bar'] },
                restore: {},
                saveAsImage: {}
            }
        },
        xAxis: {
            type: 'category',
            boundaryGap: false,
            data: ['Mon', 'Tue', 'Wed', 'Thu', 'Fri', 'Sat', 'Sun']
        },
        yAxis: {
            type: 'value',
            axisLabel: {
                formatter: '{value} °C'
            }
        },
        series: [
            {
                name: 'Highest',
                type: 'line',
                data: [10, 11, 13, 11, 12, 12, 9],
                markPoint: {
                    data: [
                        { type: 'max', name: 'Max' },
                        { type: 'min', name: 'Min' }
                    ]
                },
                markLine: {
                    data: [{ type: 'average', name: 'Avg' }]
                }
            },
            {
                name: 'Lowest',
                type: 'line',
                data: [1, -2, 2, 5, 3, 2, 0],
                markPoint: {
                    data: [{ name: '周最低', value: -2, xAxis: 1, yAxis: -1.5 }]
                },
                markLine: {
                    data: [
                        { type: 'average', name: 'Avg' },
                        [
                            {
                                symbol: 'none',
                                x: '90%',
                                yAxis: 'max'
                            },
                            {
                                symbol: 'circle',
                                label: {
                                    position: 'start',
                                    formatter: 'Max'
                                },
                                type: 'max',
                                name: '最高点'
                            }
                        ]
                    ]
                }
            }
        ]
    };
    option && myChart.setOption(option);
</script>
</body>
</html>

 浙公网安备 33010602011771号