VUE-CLI3引入ECharts
前景提要:我在使用import echars from ‘echarts’ 出现
echarts is not defined
1.在cmd打开项目目录,执行
cnpm install echarts -S
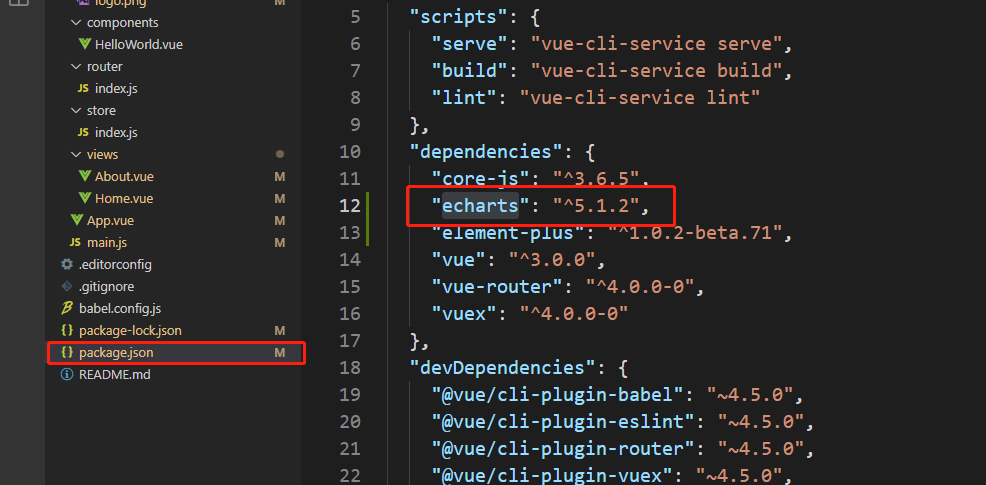
安装完毕后,你会在package.json钟看到安装的echarts版本号,如下图所示
2.界面script引入
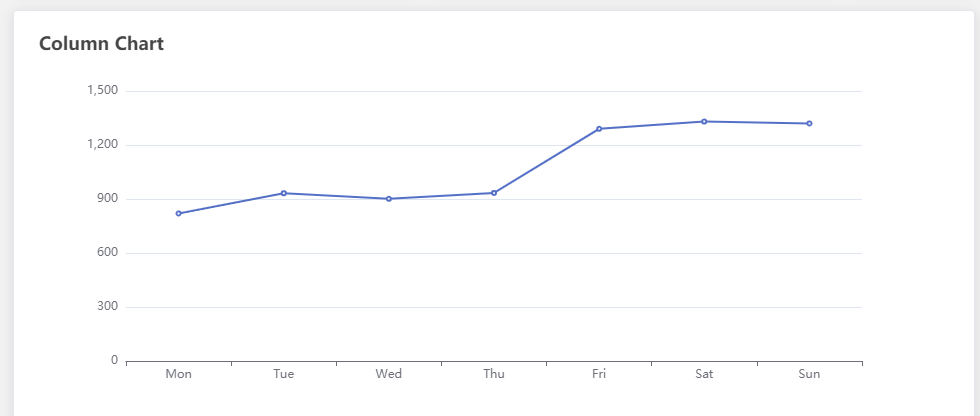
<div id='chartColumn'></div>
<script>
import * as echarts from 'echarts'
export default {
  data () {
    return {
      chartColumn: null,
      nowDateValue: new Date()
    }
  },
  mounted () {
    this.drawLine()
  },
  methods: {
    drawLine () {
      this.chartColumn = echarts.init(document.getElementById('chartColumn'))
      this.chartColumn.setOption({
        title: { text: 'Column Chart' },
        tooltip: {},
        xAxis: {
          type: 'category',
          data: ['Mon', 'Tue', 'Wed', 'Thu', 'Fri', 'Sat', 'Sun']
        },
        yAxis: {
          type: 'value'
        },
        series: [{
          data: [820, 932, 901, 934, 1290, 1330, 1320],
          type: 'line'
        }]
      })
    }
  }
}
</script>
3.显示结果:
感谢:https://zhuanlan.zhihu.com/p/130390187

