最全模型实战Pima印第安人数据集上的机器学习-分类算法(逻辑回归、朴素贝叶斯、K近邻、决策树、支持向量机、xgboost、lightgbm)
本文主要参考自
爱吃串串的瘦子 https://blog.csdn.net/weixin_41988628/article/details/83051712
易悠 https://blog.csdn.net/yizheyouye/article/details/79791473
对部分内容进行了修正
最全模型实战Pima印第安人数据集上的机器学习-分类算法(逻辑回归、朴素贝叶斯、K近邻、决策树、支持向量机、xgboost、lightgbm)
1.数据集简介
该数据集最初来自国家糖尿病/消化/肾脏疾病研究所。数据集的目标是基于数据集中包含的某些诊断测量来诊断性的预测 患者是否患有糖尿病。
从较大的数据库中选择这些实例有几个约束条件。尤其是,这里的所有患者都是Pima印第安至少21岁的女性。
数据集由多个医学预测变量和一个目标变量组成Outcome。预测变量包括患者的怀孕次数、BMI、胰岛素水平、年龄等。
import sys
import pandas as pd # 数据科学计算工具
import numpy as np # 数值计算工具
import matplotlib.pyplot as plt # 可视化
import seaborn as sns # matplotlib的高级API
import warnings
warnings.filterwarnings('ignore')
2 、加载数据并作图查看属性分布特征
- 【1】Pregnancies:怀孕次数
- 【2】Glucose:葡萄糖
- 【3】BloodPressure:血压 (mm Hg)
- 【4】SkinThickness:皮层厚度 (mm)
- 【5】Insulin:胰岛素 2小时血清胰岛素(mu U / ml
- 【6】BMI:体重指数 (体重/身高)^2
- 【7】DiabetesPedigreeFunction:糖尿病谱系功能
- 【8】Age:年龄 (岁)
- 【9】Outcome:类标变量 (0或1)
pima = pd.read_csv("D:\\xgbtest\\pima-indians-diabetes.csv")
pima.head()
| Pregnancies | Glucose | BloodPressure | SkinThickness | Insulin | BMI | DiabetesPedigreeFunction | Age | Outcome | |
|---|---|---|---|---|---|---|---|---|---|
| 0 | 6 | 148 | 72 | 35 | 0 | 33.6 | 0.627 | 50 | 1 |
| 1 | 1 | 85 | 66 | 29 | 0 | 26.6 | 0.351 | 31 | 0 |
| 2 | 8 | 183 | 64 | 0 | 0 | 23.3 | 0.672 | 32 | 1 |
| 3 | 1 | 89 | 66 | 23 | 94 | 28.1 | 0.167 | 21 | 0 |
| 4 | 0 | 137 | 40 | 35 | 168 | 43.1 | 2.288 | 33 | 1 |
pima.shape
(768, 9)
pima.describe()
| Pregnancies | Glucose | BloodPressure | SkinThickness | Insulin | BMI | DiabetesPedigreeFunction | Age | Outcome | |
|---|---|---|---|---|---|---|---|---|---|
| count | 768.000000 | 768.000000 | 768.000000 | 768.000000 | 768.000000 | 768.000000 | 768.000000 | 768.000000 | 768.000000 |
| mean | 3.845052 | 120.894531 | 69.105469 | 20.536458 | 79.799479 | 31.992578 | 0.471876 | 33.240885 | 0.348958 |
| std | 3.369578 | 31.972618 | 19.355807 | 15.952218 | 115.244002 | 7.884160 | 0.331329 | 11.760232 | 0.476951 |
| min | 0.000000 | 0.000000 | 0.000000 | 0.000000 | 0.000000 | 0.000000 | 0.078000 | 21.000000 | 0.000000 |
| 25% | 1.000000 | 99.000000 | 62.000000 | 0.000000 | 0.000000 | 27.300000 | 0.243750 | 24.000000 | 0.000000 |
| 50% | 3.000000 | 117.000000 | 72.000000 | 23.000000 | 30.500000 | 32.000000 | 0.372500 | 29.000000 | 0.000000 |
| 75% | 6.000000 | 140.250000 | 80.000000 | 32.000000 | 127.250000 | 36.600000 | 0.626250 | 41.000000 | 1.000000 |
| max | 17.000000 | 199.000000 | 122.000000 | 99.000000 | 846.000000 | 67.100000 | 2.420000 | 81.000000 | 1.000000 |
Data Visualization - 数据可视化
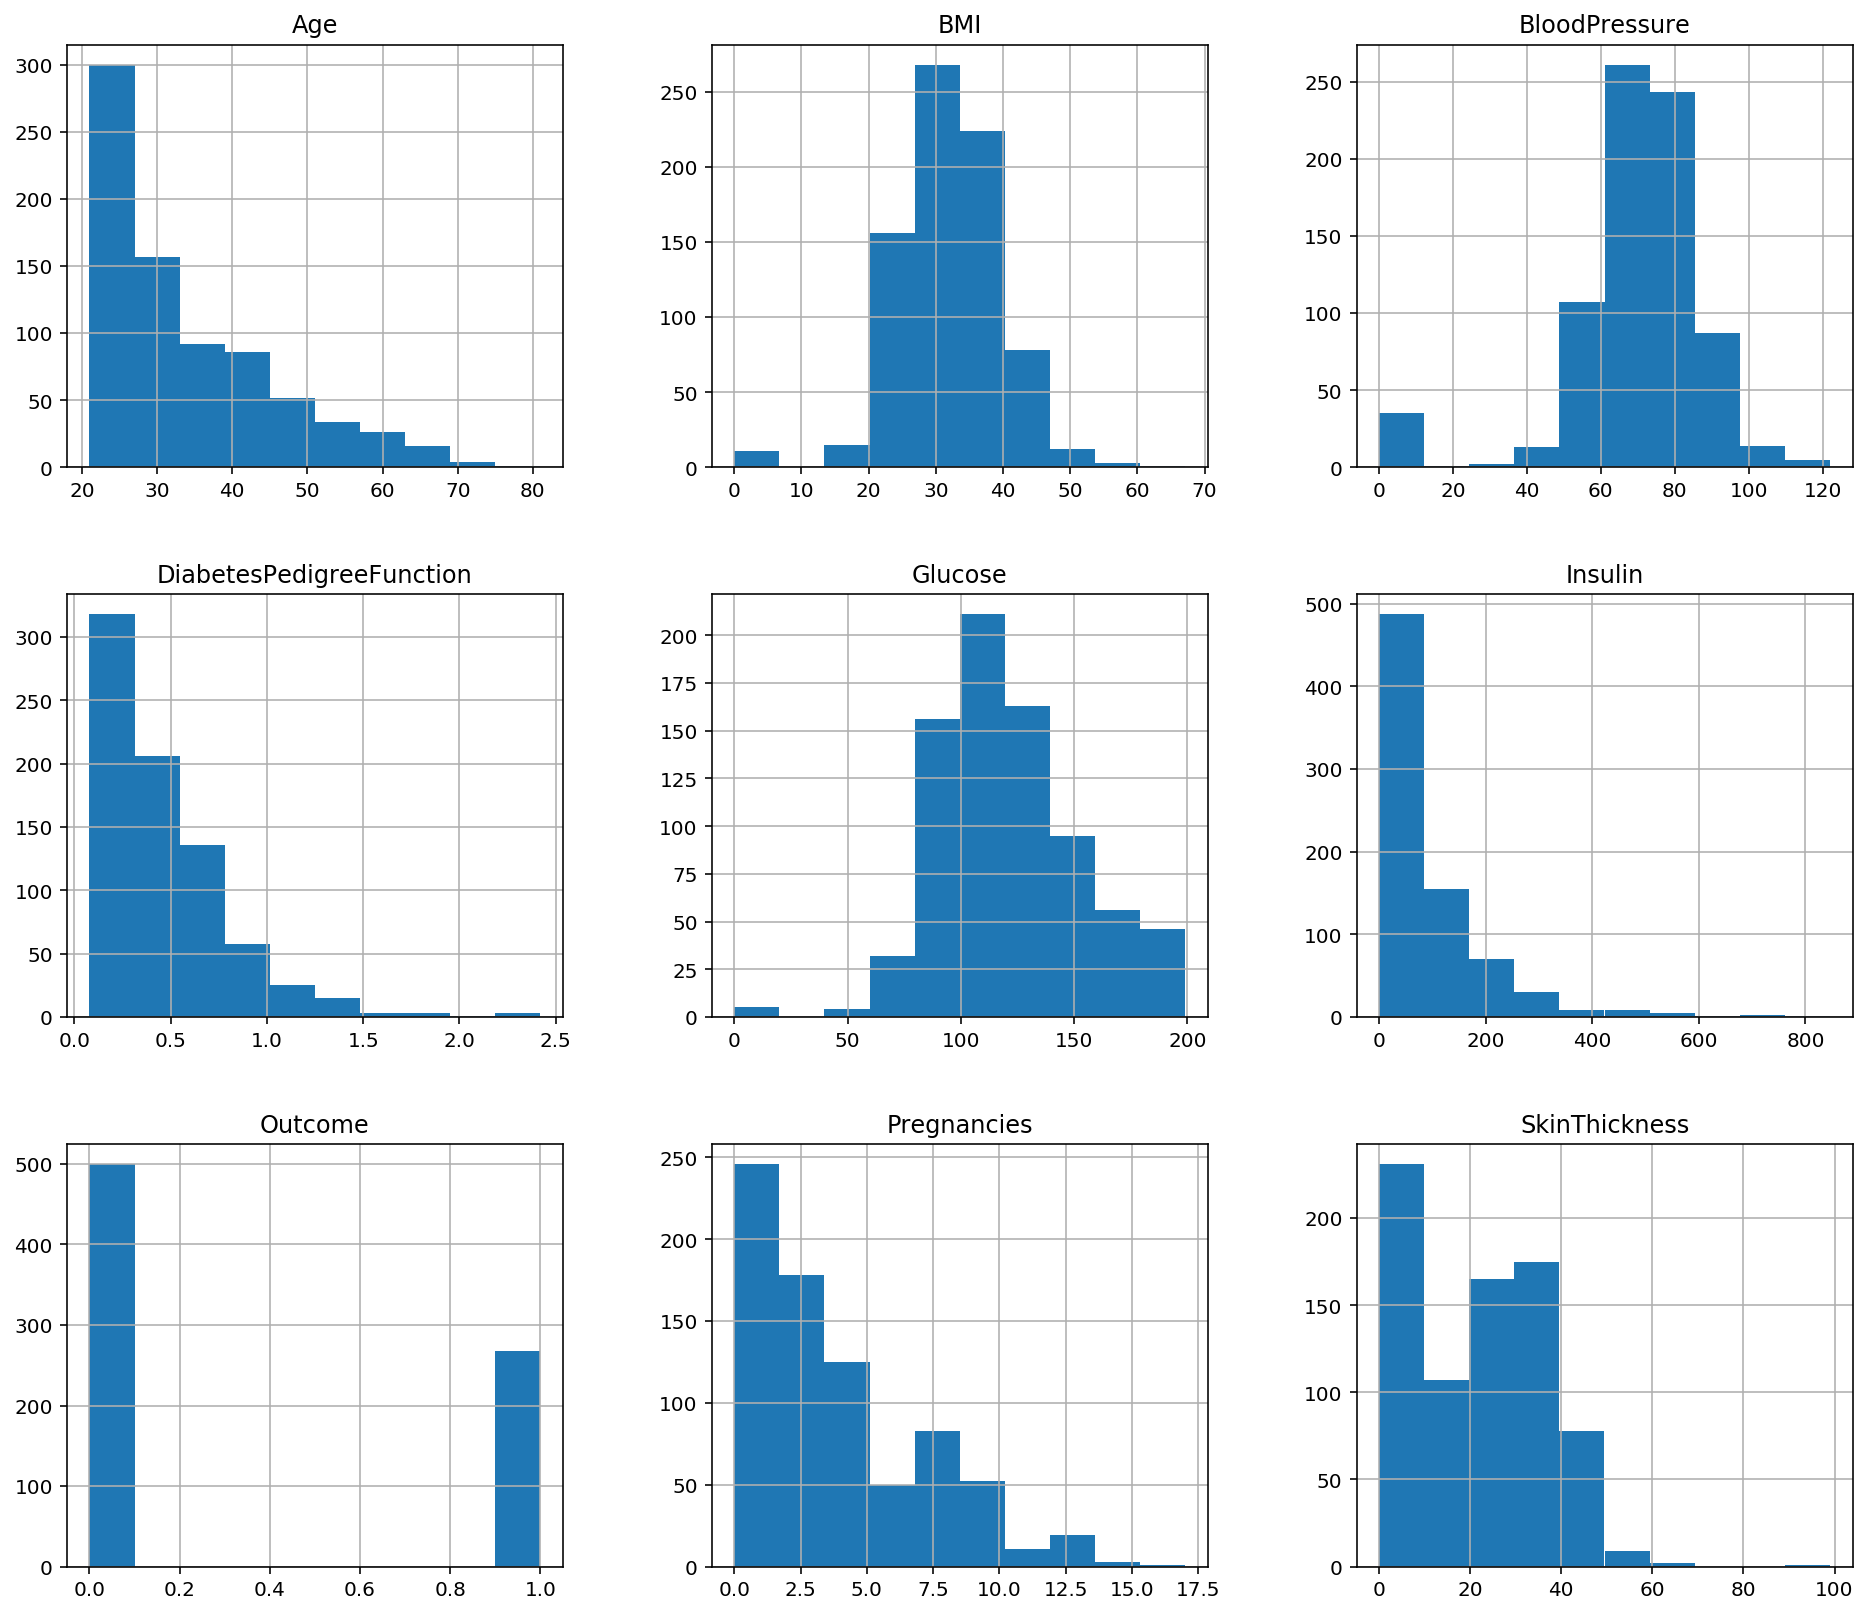
1.柱状图
pima.hist(figsize=(16,14)) #查看每个字段的数据分布;figsize的参数显示的是每个子图的长和宽
pima.hist(figsize=(16,14))
array([[<matplotlib.axes._subplots.AxesSubplot object at 0x0000022FB6DD9348>,
        <matplotlib.axes._subplots.AxesSubplot object at 0x0000022FB6DE32C8>,
        <matplotlib.axes._subplots.AxesSubplot object at 0x0000022FB6DA6448>],
       [<matplotlib.axes._subplots.AxesSubplot object at 0x0000022FBFF3A608>,
        <matplotlib.axes._subplots.AxesSubplot object at 0x0000022FB6E0C348>,
        <matplotlib.axes._subplots.AxesSubplot object at 0x0000022FBFF70788>],
       [<matplotlib.axes._subplots.AxesSubplot object at 0x0000022FBFF9CFC8>,
        <matplotlib.axes._subplots.AxesSubplot object at 0x0000022FBFFD6848>,
        <matplotlib.axes._subplots.AxesSubplot object at 0x0000022FBFFDD608>]],
      dtype=object)
2.散点图
sns.pairplot(pima,hue='Outcome')
<seaborn.axisgrid.PairGrid at 0x22fc073d188>
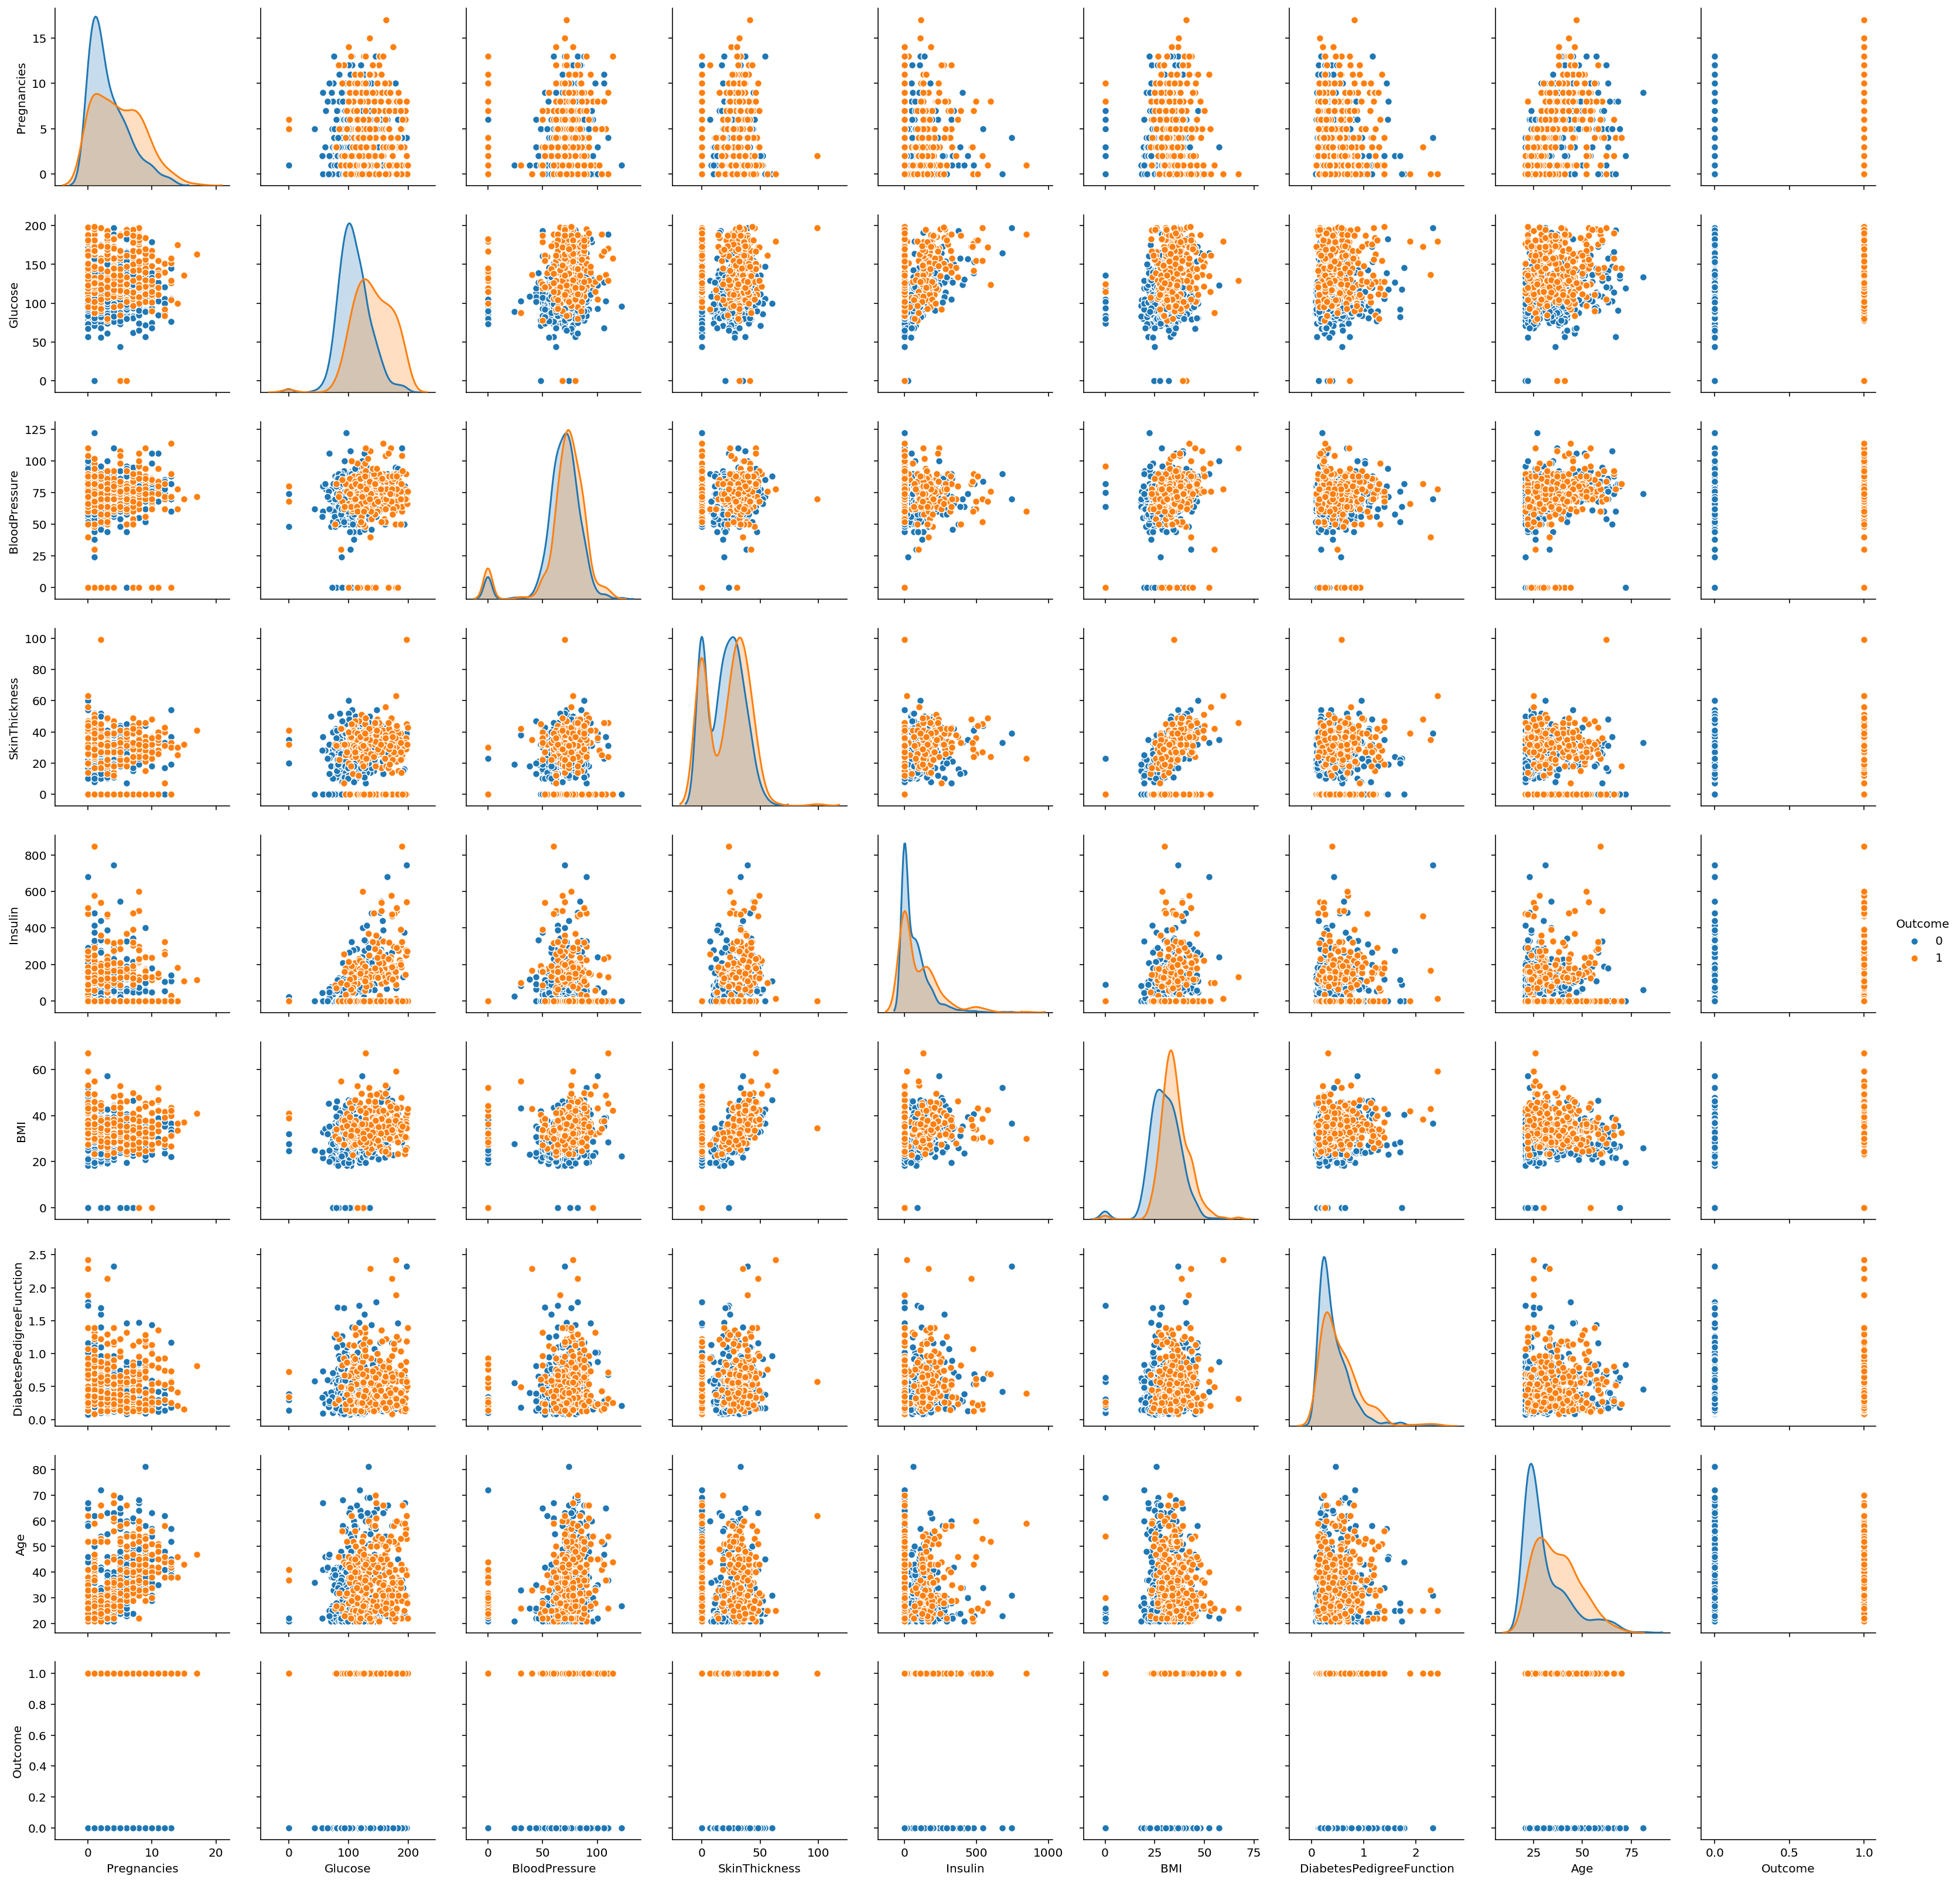
seaborn常用命令
【1】set_style()是用来设置主题的,Seaborn有5个预设好的主题:darkgrid、whitegrid、dark、white、ticks,默认为darkgrid
【2】set()通过设置参数可以用来设置背景,调色板等,更加常用
【3】displot()为hist加强版
【4】kdeplot()为密度曲线图
【5】boxplot()为箱图
【6】joinplot()联合分布图
【7】heatmap()热点图
【8】pairplot()多变量图,可以支持各种类型的变量分析,是特征分析很好用的工具
3.箱图
pandas.plot作图:数据分为Series 和 DataFrame两种类型;现释义数据为DataFrame的参数
【0】data:DataFrame
【1】x:label or position,default None 指数据框列的标签或位置参数
【2】y:label or position,default None 指数据框列的标签或位置参数
【3】kind:str(line折线图、bar条形图、barh横向条形图、hist柱状图、
box箱线图、kde Kernel的密度估计图,主要对柱状图添加Kernel概率密度线、
density same as “kde”、area区域图、pie饼图、scatter散点图、hexbin)
【4】subplots:boolean,default False,为每一列单独画一个子图
【5】sharex:boolean,default True if ax is None else False
【6】sharey:boolean,default False
【7】loglog:boolean,default False,x轴/y轴同时使用log刻度
pima.plot(kind='box', subplots=True, layout=(3,3), sharex=False,sharey=False, figsize=(16,14))
Pregnancies                    AxesSubplot(0.125,0.657941;0.227941x0.222059)
Glucose                     AxesSubplot(0.398529,0.657941;0.227941x0.222059)
BloodPressure               AxesSubplot(0.672059,0.657941;0.227941x0.222059)
SkinThickness                  AxesSubplot(0.125,0.391471;0.227941x0.222059)
Insulin                     AxesSubplot(0.398529,0.391471;0.227941x0.222059)
BMI                         AxesSubplot(0.672059,0.391471;0.227941x0.222059)
DiabetesPedigreeFunction          AxesSubplot(0.125,0.125;0.227941x0.222059)
Age                            AxesSubplot(0.398529,0.125;0.227941x0.222059)
Outcome                        AxesSubplot(0.672059,0.125;0.227941x0.222059)
dtype: object

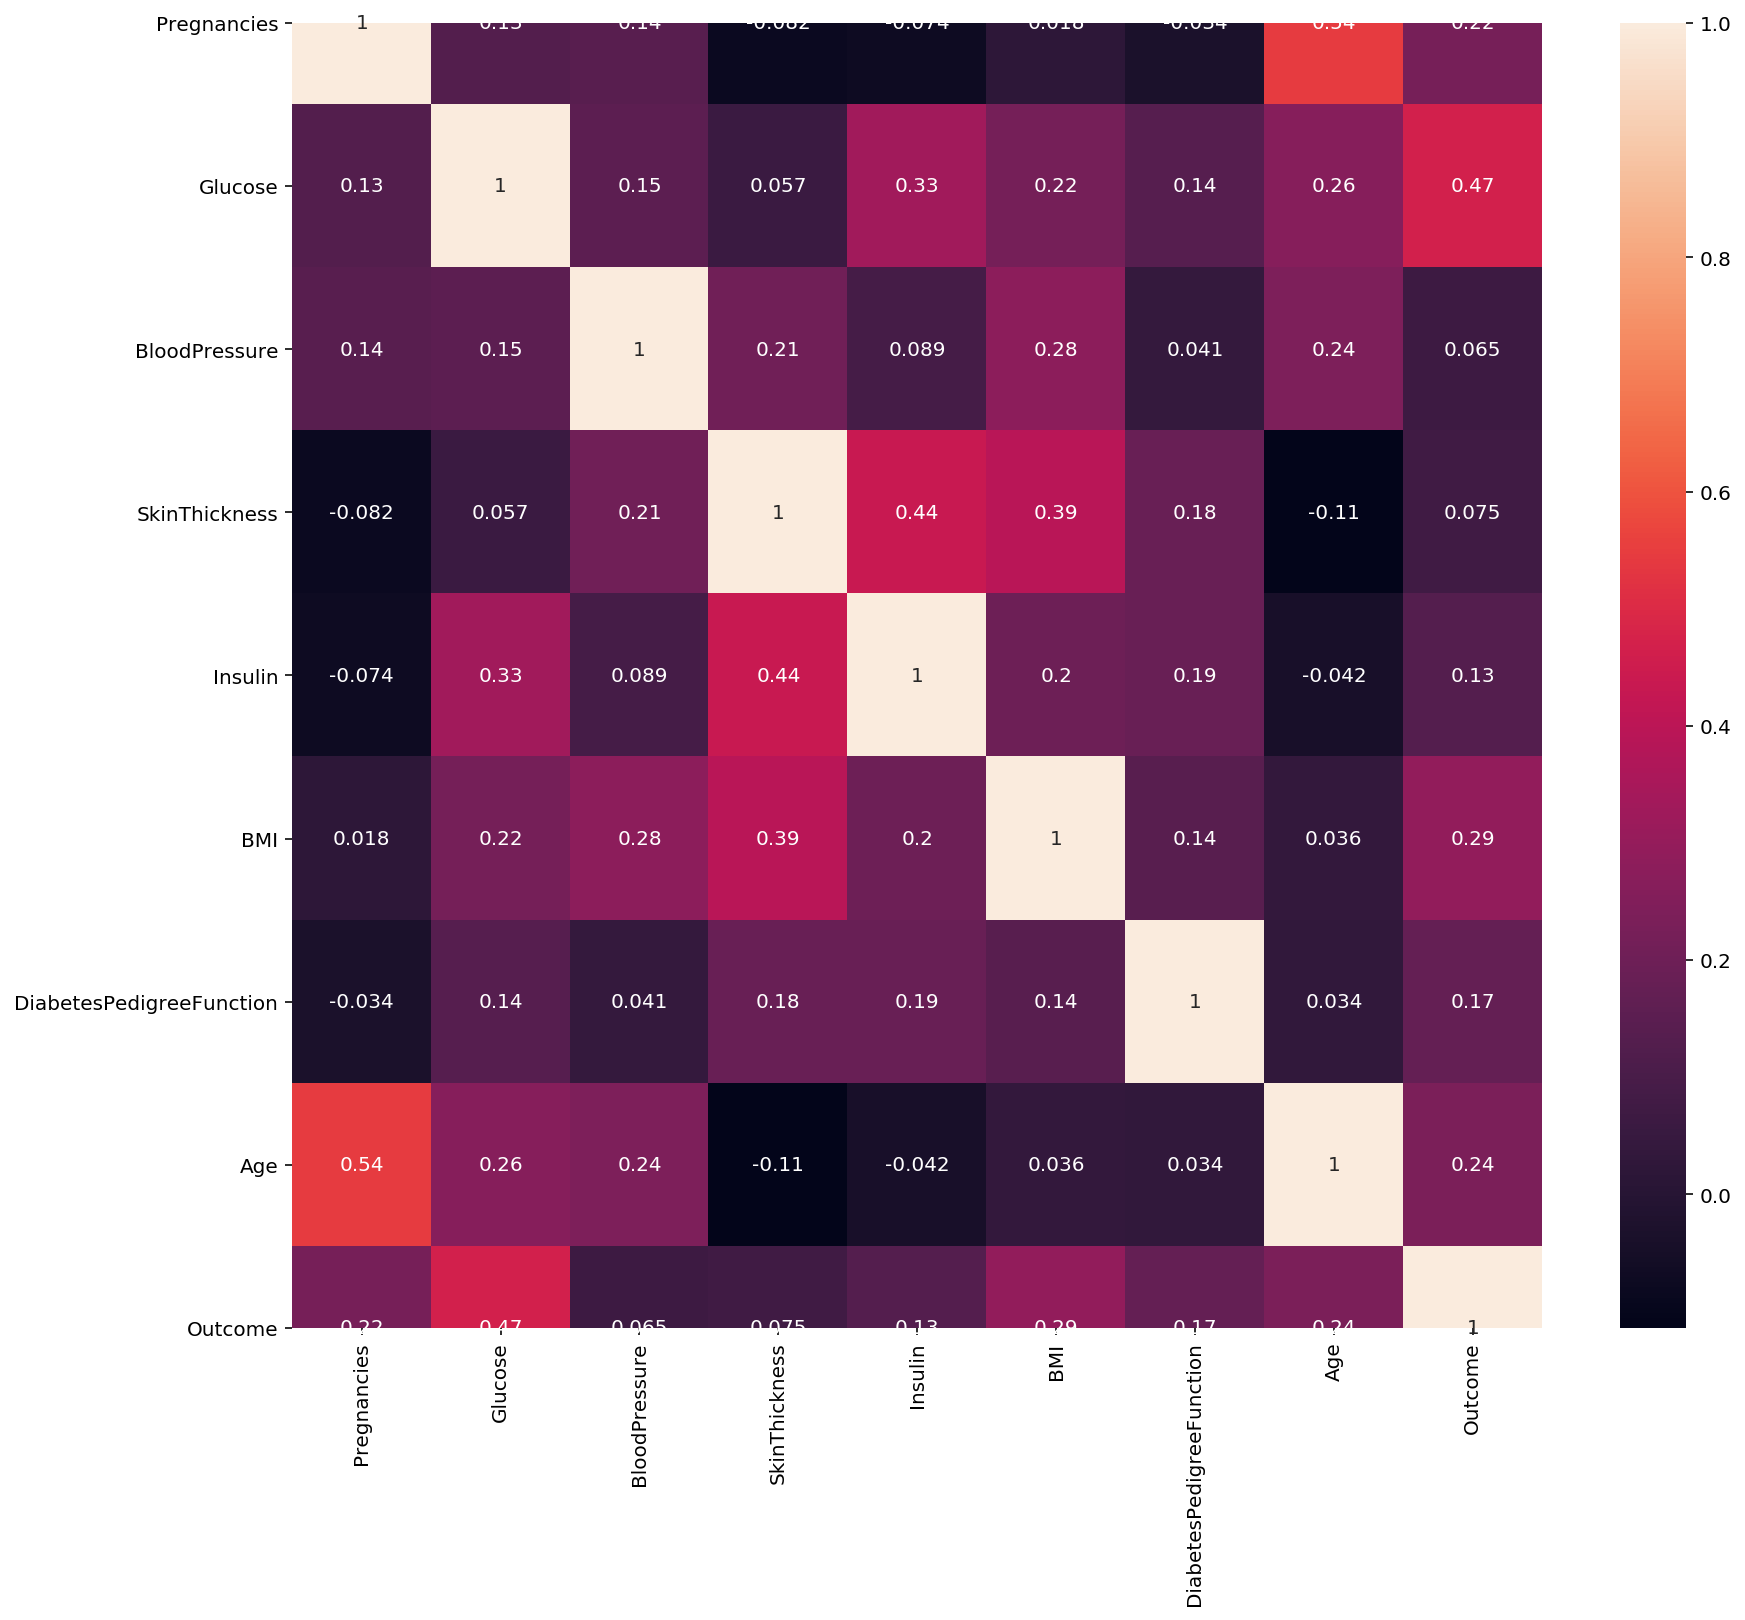
4.热度图
column_x = pima.columns[0:len(pima.columns) - 1] # 选择特征列,去掉目标列

column_x # 显示所有特征列信息

corr = pima[pima.columns].corr() # 计算变量的相关系数,得到一个N * N的矩阵

plt.subplots(figsize=(14,12)) # 可以先试用plt设置画布的大小,然后在作图,修改
sns.heatmap(corr, annot = True) # 使用热度图可视化这个相关系数矩阵
<matplotlib.axes._subplots.AxesSubplot at 0x22fc5906608>
3、 数据预处理——特征工程
3.1、特征选择
导入和特征选择相关的包
评分函数
1.SelectKBest() #只保留K个最高分的特征,能够返回特征评价的得分 SelectKBest(score_func=
2.SelectPercentile() #只保留用户指定百分比的最高得分的特征,能够返回特征评价的得分 SelectPercentile(score_func=
使用常见的单变量统计检验:假正率SelectFpr,错误发现率SelectFdr,或者总体错误率SelectFwe
3.GenericUnivariateSelect() #通过结构化策略进行特征选择,通过超参数搜索估计器进行特征选择
将特征输入到评分函数,返回一个单变量的f_score(F检验的值)或p-values(P值,假设检验中的一个标准,P-value用来和显著性水平作比较),
注意SelectKBest 和 SelectPercentile只有得分,没有p-value。
其中的参数score_func有以下选项:
【1】回归:f_regression:相关系数,计算每个变量与目标变量的相关系数,然后计算出F值和P值
mutual_info_regression:互信息,互信息度量X和Y共享的信息:
它度量知道这两个变量其中一个,对另一个不确定度减少的程度。
【2】分类:chi2:卡方检验
f_classif:方差分析,计算方差分析(ANOVA)的F值(组间均方/组内均方);
mutual_info_classif:互信息,互信息方法可以捕捉任何一种统计依赖,但是作为非参数法, 需要更多的样本进行准确的估计。
from sklearn.feature_selection import SelectKBest
from sklearn.feature_selection import chi2

X = pima.iloc[:, 0:8] # 特征列 0-7列,不含第8列
Y = pima.iloc[:, 8] # 目标列为第8列

select_top_4 = SelectKBest(score_func=chi2, k =4) # 通过卡方检验选择4个得分最高的特征
fits = select_top_4.fit(X, Y) #将特征输入到评分函数,获取特征信息和目标值信息
features = fits.transform(X) #展现特征转换后的结果
fits.get_support(indices=True).tolist()  #得到宣传的相关性排名前4的列[1,4,5,7]
# 因此,表现最佳的特征是:Glucose-葡萄糖、Insulin-胰岛素、BMI指数、Age-年龄
# features[0:5] #新特征列
[1, 4, 5, 7]
3.1 构造新特征DataFrame
X_features = pd.DataFrame(data = features, columns=["Glucose","Insulin","BMI","Age"]) # 构造新特征DataFrame
Y_features = pd.DataFrame(data = Y, columns=["Outcome"])
# 构造新特征DataFrame
3.2、 Standardization - 标准化
它将属性值更改为 均值为0,标准差为1 的 高斯分布. 当算法期望输入特征处于高斯分布时,它非常有用
from sklearn.preprocessing import StandardScaler
rescaledX = StandardScaler().fit_transform(X_features)
#通过sklearn的preprocessing数据预处理中StandardScaler特征缩放 标准化特征信息
X = pd.DataFrame(data = rescaledX, columns = X_features.columns)
 # 构建新特征DataFrame
X.head()
| Glucose | Insulin | BMI | Age | |
|---|---|---|---|---|
| 0 | 0.848324 | -0.692891 | 0.204013 | 1.425995 |
| 1 | -1.123396 | -0.692891 | -0.684422 | -0.190672 |
| 2 | 1.943724 | -0.692891 | -1.103255 | -0.105584 |
| 3 | -0.998208 | 0.123302 | -0.494043 | -1.041549 |
| 4 | 0.504055 | 0.765836 | 1.409746 | -0.020496 |
3.3、将数据集切分——训练集和测试集
from sklearn.model_selection import train_test_split

seed = 7 #重现随机生成的训练
test_size = 0.33 #33%测试,67%训练
X_train, X_test, Y_train, Y_test = train_test_split(X, Y_features, test_size=test_size, random_state=seed)
4、 构建二分类算法模型
from sklearn.model_selection import KFold,StratifiedKFold
from sklearn.model_selection import cross_val_score
from sklearn.linear_model import LogisticRegression
from sklearn.naive_bayes import GaussianNB
from sklearn.neighbors import KNeighborsClassifier
from sklearn.tree import DecisionTreeClassifier
from sklearn.svm import SVC
from xgboost import XGBClassifier
from lightgbm import LGBMClassifier
models = []
models.append(("LR", LogisticRegression())) #逻辑回归
models.append(("NB", GaussianNB())) # 高斯朴素贝叶斯
models.append(("KNN", KNeighborsClassifier())) #K近邻分类
models.append(("DT", DecisionTreeClassifier())) #决策树分类
models.append(("SVM", SVC())) # 支持向量机分类
models.append(("xgboost", XGBClassifier())) #xgboost分类
models.append(("lightgbm", LGBMClassifier())) #lightgbm分类
cross_val_score()函数
sklearn.cross_validation.cross_val_score(estimator, X, y=None, scoring=None, cv=None, n_jobs=1, verbose=0, fit_params=None, pre_dispatch='2*n_jobs')
参数
estimator:数据对象
X:数据
y:预测数据
soring:调用的方法
cv:交叉验证生成器或可迭代的次数
n_jobs:同时工作的cpu个数(-1代表全部)
verbose:详细程度
fit_params:传递给估计器的拟合方法的参数
pre_dispatch:控制并行执行期间调度的作业数量。
KFold——K折交叉验证:
这是将数据集分成K份的官方给定方案,所谓K折就是将数据集通过K次分割,使得所有数据既在训练集出现过,又在测试集出现过,当然,每次分割中不会有重叠。相当于无放回抽样。
StratifiedKFold用法类似Kfold,但是他是分层采样,确保训练集,测试集中各类别样本的比例与原始数据集中相同。
sklearn.model_selection.KFold(n_splits=3, shuffle=False, random_state=None)
思路:将训练/测试数据集划分n_splits个互斥子集,每次用其中一个子集当作验证集,剩下的n_splits-1个作为训练集,进行n_splits次训练和测试,得到n_splits个结果
注意点:对于不能均等份的数据集,其前n_samples % n_splits子集拥有n_samples // n_splits + 1个样本,其余子集都只有n_samples // n_splits样本
参数说明:
n_splits:表示划分几等份
shuffle:在每次划分时,是否进行洗牌
①若为Falses时,其效果等同于random_state等于整数,每次划分的结果相同
②若为True时,每次划分的结果都不一样,表示经过洗牌,随机取样的
random_state:随机种子数
属性:
①get_n_splits(X=None, y=None, groups=None):获取参数n_splits的值
②split(X, y=None, groups=None):将数据集划分成训练集和测试集,返回索引生成器
results = []
names = []
for name, model in models:
    kflod = KFold(n_splits=10, random_state=22)
    cv_result = cross_val_score(model, X_train,Y_train, cv = kflod,scoring="accuracy")
    names.append(name)
    results.append(cv_result)

for i in range(len(names)):
    print(names[i], results[i].mean())
LR 0.7505656108597286
NB 0.7604449472096532
KNN 0.7292986425339366
DT 0.7177224736048267
SVM 0.760369532428356
xgboost 0.7565987933634993
lightgbm 0.748868778280543
不同模型下的可视化结果
1.盒图:
ax = sns.boxplot(data = results)
ax.set_xticklabels(names)
[Text(0, 0, 'LR'),
 Text(0, 0, 'NB'),
 Text(0, 0, 'KNN'),
 Text(0, 0, 'DT'),
 Text(0, 0, 'SVM'),
 Text(0, 0, 'xgboost'),
Text(6.5, 0, 'lightgbm')]
2.热力图
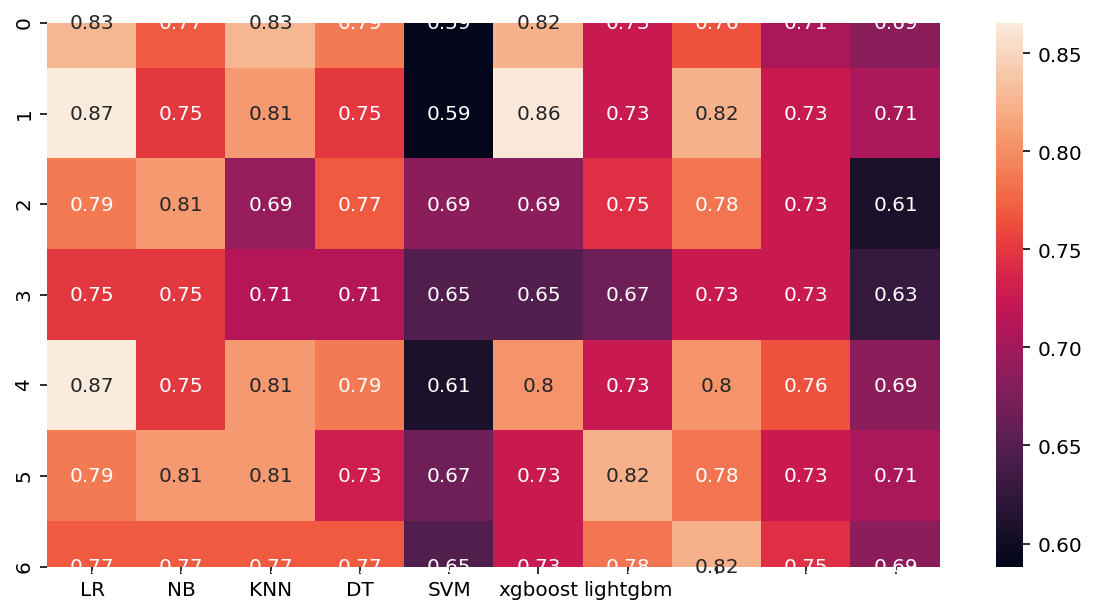
plt.subplots(figsize=(10,5)) # 可以先试用plt设置画布的大小,然后在作图,修改
ax = sns.heatmap(data = results,annot = True)
ax.set_xticklabels(names)
[Text(0.5, 0, 'LR'),
 Text(1.5, 0, 'NB'),
 Text(2.5, 0, 'KNN'),
 Text(3.5, 0, 'DT'),
 Text(4.5, 0, 'SVM'),
 Text(5.5, 0, 'xgboost'),
Text(0, 0, 'lightgbm')]
3.散点图
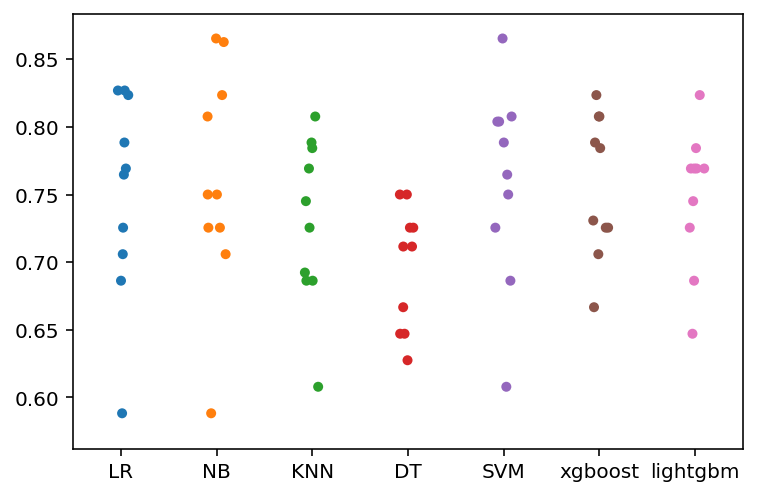
ax = sns.stripplot(data = results)
ax.set_xticklabels(names)
[Text(0, 0, 'LR'),
 Text(0, 0, 'NB'),
 Text(0, 0, 'KNN'),
 Text(0, 0, 'DT'),
 Text(0, 0, 'SVM'),
 Text(0, 0, 'xgboost'),
Text(0, 0, 'lightgbm')]

4.小提琴图:
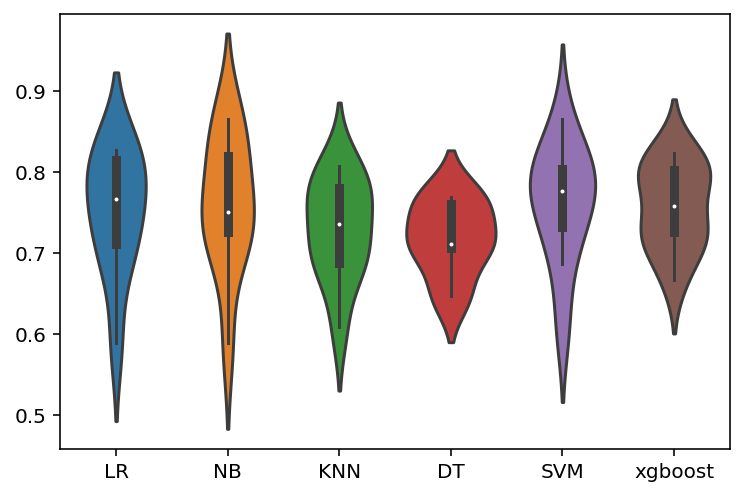
中间的白点是中位数,黑色粗线对应分位数
ax = sns.violinplot(data = results)
ax.set_xticklabels(names)
[Text(0, 0, 'LR'),
 Text(0, 0, 'NB'),
 Text(0, 0, 'KNN'),
 Text(0, 0, 'DT'),
 Text(0, 0, 'SVM'),
 Text(0, 0, 'xgboost')]
5、模型评估(参数选择)
1.PCA SVM
from sklearn.decomposition import KernelPCA

kpca = KernelPCA(n_components = 2, kernel = 'rbf')  #kernel = 'rbf' 核函数为 高斯核函数,n_components:降维后的维数 2维
X_train_pca = kpca.fit_transform(X_train)  #fit_transform(trainData)对部分数据先拟合fit,找到该part的整体指标,如均值、方差、最大值最小值等等(根据具体转换的目的),然后对该trainData进行转换transform,从而实现数据的标准化、归一化等等。
X_test_pca = kpca.transform(X_test)
from sklearn.svm import SVC
from sklearn.metrics import classification_report, confusion_matrix
from sklearn.model_selection import GridSearchCV


classifier = SVC(kernel = 'rbf')
classifier.fit(X_train_pca, Y_train)
SVC(C=1.0, cache_size=200, class_weight=None, coef0=0.0,
    decision_function_shape='ovr', degree=3, gamma='auto_deprecated',
    kernel='rbf', max_iter=-1, probability=False, random_state=None,
    shrinking=True, tol=0.001, verbose=False)
参数:
C:C-SVC的惩罚参数C 默认值是1.0
C越大,即对误分类的惩罚增大,趋向于对训练集全分对的情况,这样对训练集测试时准确率很高,但泛化能力弱。C值小,对误分类的惩罚减小,允许容错,将他们当成噪声点,泛化能力较强。
kernel :核函数,默认是rbf,可以是‘linear’, ‘poly’, ‘rbf’, ‘sigmoid’, ‘precomputed’
-
0 – 线性:u'v
-
1 – 多项式:(gammau'v + coef0)^degree
-
2 – RBF函数:exp(-gamma|u-v|^2)
-
3 –sigmoid:tanh(gammau'v + coef0)
degree :多项式poly函数的维度,默认是3,选择其他核函数时会被忽略。
gamma : ‘rbf’,‘poly’ 和‘sigmoid’的核函数参数。默认是’auto’,则会选择1/n_features
coef0 :核函数的常数项。对于‘poly’和 ‘sigmoid’有用。
probability :是否采用概率估计?.默认为False
shrinking :是否采用shrinking heuristic方法,默认为true
tol :停止训练的误差值大小,默认为1e-3
cache_size :核函数cache缓存大小,默认为200
class_weight :类别的权重,字典形式传递。设置第几类的参数C为weight*C(C-SVC中的C)
verbose :允许冗余输出?
max_iter :最大迭代次数。-1为无限制。
decision_function_shape :‘ovo’, ‘ovr’ or None, default=None3
random_state :数据洗牌时的种子值,int值
主要调节的参数有:C、kernel、degree、gamma、coef0。
2.xgboost
xgb1 = XGBClassifier(
    learning_rate = 0.1,
    n_estimators = 1000,
    max_depth = 5,
    min_child_weight = 1,
    gamma = 0,
    subsample = 0.8,
    colsample_bytree = 0.8,
    objective = 'binary:logistic',
    nthread = 4,
    scale_pos_weight = 1,
    seed = 27
    )
model = XGBClassifier()
learning_rate = [0.0001,0.001,0.01,0.1,0.2,0.3] #学习率
gamma = [1, 0.1, 0.01, 0.001]

param_grid = dict(learning_rate = learning_rate,gamma = gamma) #转化为字典格式,网络搜索要求

kflod = StratifiedKFold(n_splits=10, shuffle = True,random_state=7) #将训练/测试数据集划分10个互斥子集, StratifiedKFold用法类似Kfold,但是他是分层采样,确保训练集,测试集中各类别样本的比例与原始数据集中相同。

grid_search = GridSearchCV(model,param_grid,scoring = 'neg_log_loss',n_jobs = -1,cv = kflod)

#scoring指定损失函数类型,n_jobs指定全部cpu跑,cv指定交叉验证

grid_result = grid_search.fit(X_train_pca, Y_train) #运行网格搜索

print("Best: %f using %s" % (grid_result.best_score_,grid_search.best_params_))
print('穷举后 最优的参数: ',grid_search.best_estimator_)
#best_params_:描述了已取得最佳结果的参数的组合
#best_score_:成员提供优化过程期间观察到的最好的评分
#具有键作为列标题和值作为列的dict,可以导入到DataFrame中。
#注意,“params”键用于存储所有参数候选项的参数设置列表。

# 打印分析的过程
# means = grid_result.cv_results_['mean_test_score']
# params = grid_result.cv_results_['params']
# for mean,param in zip(means,params):
#     print("%f  with:   %r" % (mean,param))
Best: -0.564962 using {'gamma': 1, 'learning_rate': 0.1}
穷举后 最优的参数:  XGBClassifier(base_score=0.5, booster=None, colsample_bylevel=1,
              colsample_bynode=1, colsample_bytree=1, gamma=1, gpu_id=-1,
              importance_type='gain', interaction_constraints=None,
              learning_rate=0.1, max_delta_step=0, max_depth=6,
              min_child_weight=1, missing=nan, monotone_constraints=None,
              n_estimators=100, n_jobs=0, num_parallel_tree=1,
              objective='binary:logistic', random_state=0, reg_alpha=0,
              reg_lambda=1, scale_pos_weight=1, subsample=1, tree_method=None,
              validate_parameters=False, verbosity=None)
GridSearchCV 相关参数
初始化了一个GridSearchCV对象,用于对支持向量机流水线的训练与调优。将GridSearchCV的param_grid参数以字典的方式定义为待调优参数。
(1)estimator
选择使用的分类器,并且传入除需要确定最佳的参数之外的其他参数。每一个分类器都需要一个scoring参数,或者score方法:estimator=RandomForestClassifier(min_samples_split=100,min_samples_leaf=20,max_depth=8,max_features='sqrt',random_state=10),
(2 param_grid
需要最优化的参数的取值,值为字典或者列表,例如:param_grid =param_test1,param_test1 = {'n_estimators':range(10,71,10)}。
(3)scoring=None
模型评价标准,默认None,这时需要使用score函数;或者如scoring='roc_auc',根据所选模型不同,评价准则不同。字符串(函数名),或是可调用对象,需要其函数签名形如:scorer(estimator, X, y);如果是None,则使用estimator的误差估计函数。具体值的选取看本篇第三节内容。
(4)fit_params=None
(5) n_jobs=1
n_jobs: 并行数,int:个数,-1:跟CPU核数一致, 1:默认值
进行预测的常用方法和属性
grid.fit():运行网格搜索
grid_scores_:给出不同参数情况下的评价结果
best_params_:描述了已取得最佳结果的参数的组合
best_score_:提供优化过程期间观察到的最好的评分
cv_results_ : dict of numpy (masked) ndarrays
具有键作为列标题和值作为列的dict,可以导入到DataFrame中。注意,“params”键用于存储所有参数候选项的参数设置列表。
运用调好参数的模型正式训练数据
classifier = XGBClassifier(
    learning_rate = 0.1,
    n_estimators = 1000,
    max_depth = 5,
    min_child_weight = 1,
    gamma = 1,
    subsample = 0.8,
    colsample_bytree = 0.8,
    objective = 'binary:logistic',
    nthread = 4,
    scale_pos_weight = 1,
    seed = 27
    )
classifier.fit(X_train_pca, Y_train)
XGBClassifier(base_score=0.5, booster=None, colsample_bylevel=1,
              colsample_bynode=1, colsample_bytree=0.8, gamma=1, gpu_id=-1,
              importance_type='gain', interaction_constraints=None,
              learning_rate=0.1, max_delta_step=0, max_depth=5,
              min_child_weight=1, missing=nan, monotone_constraints=None,
              n_estimators=1000, n_jobs=4, nthread=4, num_parallel_tree=1,
              objective='binary:logistic', random_state=27, reg_alpha=0,
              reg_lambda=1, scale_pos_weight=1, seed=27, subsample=0.8,
              tree_method=None, validate_parameters=False, verbosity=None)
5.1.详细评估
classification_report
y_pred = classifier.predict(X_test_pca)   #输入测试数据 的到 y的 预测值

cm = confusion_matrix(Y_test, y_pred)#混淆矩阵
cm
array([[132,  30],
       [ 47,  45]], dtype=int64)
结果说明:把0预测成0的有132个,把0预测成1的有30个,把1预测成0的有47个,把1预测成1的有55个。
print(classification_report(Y_test, y_pred))#显示准确率
              precision    recall  f1-score   support

           0       0.74      0.81      0.77       162
           1       0.60      0.49      0.54        92

    accuracy                           0.70       254
   macro avg       0.67      0.65      0.66       254
weighted avg       0.69      0.70      0.69       254
准确率:精确率是针对我们预测结果而言的,它表示的是预测为正的样本中有多少是真正的正样本。
所有识别为”1”的数据中,正确的比率是多少。
如上题识别出来178个结果是“0”, 而只有132个结果正确,有47个实现是非“0”的数据。 所以准确率就为74%
召回率:召回率是针对我们原来的样本而言的,它表示的是样本中的正例有多少被预测正确了
所有样本为1的数据中,最后真正识别出1的比率。
如上题162个样本”0”, 只识别出了132个是“0”, 其它30个是识别成了其它数据。 所以召回率是81%
F1-score:
是准确率与召回率的综合。 可以认为是平均效果。
F1值是精确度和召回率的调和平均值:2F1=1P+1R 2F1=1P+1R F1=2P×RP+R F1=2P×RP+R
精确度和召回率都高时, F1 F1值也会高. F1 F1值在1时达到最佳值(完美的精确度和召回率),最差为0.在二元分类中, F1 F1值是测试准确度的量度。
例子:当一个搜索引擎返回30个页面时,只有20页是相关的,而没有返回40个额外的相关页面,其精度为20/30 = 2/3,而其召回率为20/60 = 1/3。在这种情况下,精确度是“搜索结果有多大用处”,而召回是“结果如何完整”。
详细定义如下:
对于数据测试结果有下面4种情况:
TP: 预测为正, 实现为正
FP: 预测为正, 实现为负
FN: 预测为负,实现为正
TN: 预测为负, 实现为负
准确率: TP/ (TP+FP)
召回率: TP(TP + FN)
F1-score: 2TP/(2TP + FP + FN)
一般(粗)评估——accuracy_score
sklearn.metrics.accuracy_score(y_true, y_pred, normalize=True, sample_weight=None)
分类准确率分数是指所有分类正确的百分比。分类准确率这一衡量分类器的标准比较容易理解,但是它不能告诉你响应值的潜在分布,并且它也不能告诉你分类器犯错的类型。
normalize:默认值为True,返回正确分类的比例;如果为False,返回正确分类的样本数
from sklearn.metrics import accuracy_score
accuracy = accuracy_score(Y_test, y_pred) #显示准确率——分类0和1的total
print("Accuracy: %.2f%%" % (accuracy * 100.0))
Accuracy: 69.69%
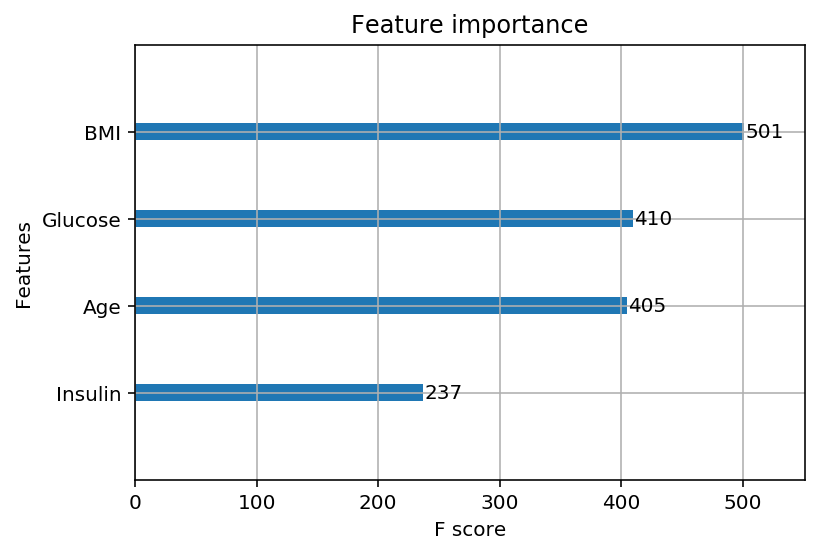
判断比较不同特征的重要程度
#判断特征的重要程度
from xgboost import plot_importance
from matplotlib import pyplot

#使用XGBoost进行训练
model = XGBClassifier()
model.fit(X_train,Y_train)

# 绘制重要性曲线,max_num_feature参数设置输出前20重要的特征()
plot_importance(model,max_num_features=20)
plt.show()
