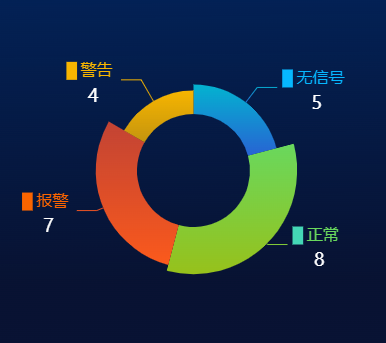
echarts 画一个南丁格尔玫瑰饼图
const datas = [
    {
        name: '无信号',
        value: 5,
        label: { color: '#06B7FFFF' }
    },
    {
        name: '正常',
        value: 8,
        label: { color: '#69D85DFF' }
    },
    {
        name: '报警',
        value: 7,
        label: { color: '#FA6400FF' }
    },
    {
        name: '警告',
        value: 4,
        label: { color: '#F7B500FF' }
    }
]

option = {
    tooltip: {
        trigger: 'item',
        formatter: '{d}%'
    },
    series: [
        {
            name: '',
            type: 'pie',
            radius: ['30%', '55%'],
            center: ['50%', '50%'],
            roseType: 'radius',
            label: {
                formatter(params, e) {
                    debugger
                    if (params.data.name == "无信号") {
                        return `{type1|  } {a|${params.data.name}} \n {b|${params.value}}`;
                    } else if (params.data.name == "正常") {
                        return `{type2|  } {a|${params.data.name}} \n {b|${params.value}}`;
                    }
                    else if (params.data.name == "报警") {
                        return `{type3|  } {a|${params.data.name}} \n {b|${params.value}}`;
                    } else if (params.data.name == "警告") {
                        return `{type4|  } {a|${params.data.name}} \n {b|${params.value}}`;
                    }
                    //var str = [
                    //    '{x|  } {a|{b}}',
                    //    '{b|{c}}'
                    //].join('\n');
                    //debugger
                    //return str;
                },
                rich: {
                    a: {
                        fontSize: 16,
                        marginTop: 10,
                        top: 10
                    },
                    b: {
                        color: '#fff',
                        fontSize: 18,
                        align: 'center'
                    },
                    type1: {
                        fontSize: 18,
                        lineHeight: 34,
                        backgroundColor: '#06B7FFFF'
                    },
                    type2: {
                        fontSize: 18,
                        lineHeight: 34,
                        backgroundColor: '#44D7B6FF'
                    },
                    type3: {
                        fontSize: 18,
                        lineHeight: 34,
                        backgroundColor: '#FA6400FF'
                    },
                    type4: {
                        fontSize: 18,
                        lineHeight: 34,
                        backgroundColor: '#F7B500FF'
                    },
                }
            },
            labelLine: {
                length: 1,
                length2: 20
            },
            data: datas,
            itemStyle: {
                normal: {
                    color: function (params) {
                        var colorList = [
                            new echarts.graphic.LinearGradient(0, 0, 0, 1, [{ //无信号
                                offset: 0, color: '#03b3d0'
                            }, {
                                offset: 1, color: '#2863d3'
                            }]),
                            new echarts.graphic.LinearGradient(0, 0, 0, 1, [{  //正常
                                offset: 0, color: '#69D85DFF'
                            }, {
                                offset: 1, color: '#97c11b'
                            }]),
                            new echarts.graphic.LinearGradient(0, 0, 0, 1, [{ //报警
                                offset: 0, color: '#d74832e6' // 颜色渐变
                            }, {
                                offset: 1, color: '#fb5a1c'   // 颜色渐变
                            }]),
                            new echarts.graphic.LinearGradient(0, 0, 0, 1, [{  //警告
                                offset: 0, color: '#F7B500FF'
                            }, {
                                offset: 1, color: '#f7b500c9'
                            }]),
                        ];
                        return colorList[params.dataIndex % colorList.length];
                    }
                }
            }
        }
    ]
}

var chartDom = document.getElementById('equipment-status');

var myChart = echarts.init(chartDom);
option && myChart.setOption(option);


