Drawing a Bee Swarm Plot in R/ Python
Bee swarm plot is a categorical scatter plot.
A normal scatter plot has problem when you come to compare groups of data side by side. Because there are too many points at a similar position that you cannot read out useful information from it. In short, overlapping / overploting is very heavy.
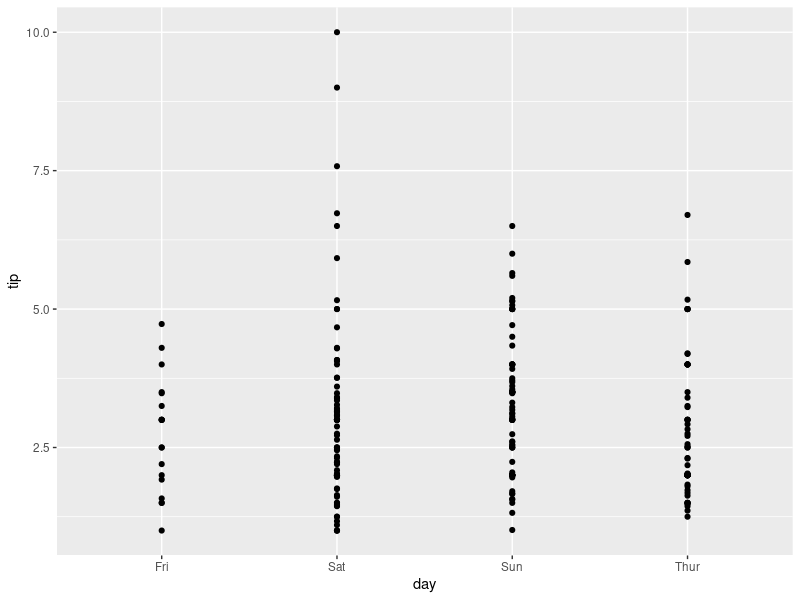
A traditional fix approach this problem is boxplot. Boxplot uses some statistics indices to draw a "box", rather than showing full series of scatter points. By this method, people can read and compare series of data easily.
However still it has disadvantage. Boxplot omits the infomation of individual points and it is a overview of the whole series. What if I care about some key individuals? Here is how bee swarm comes to help.
For example, a boxplot will miss some information:
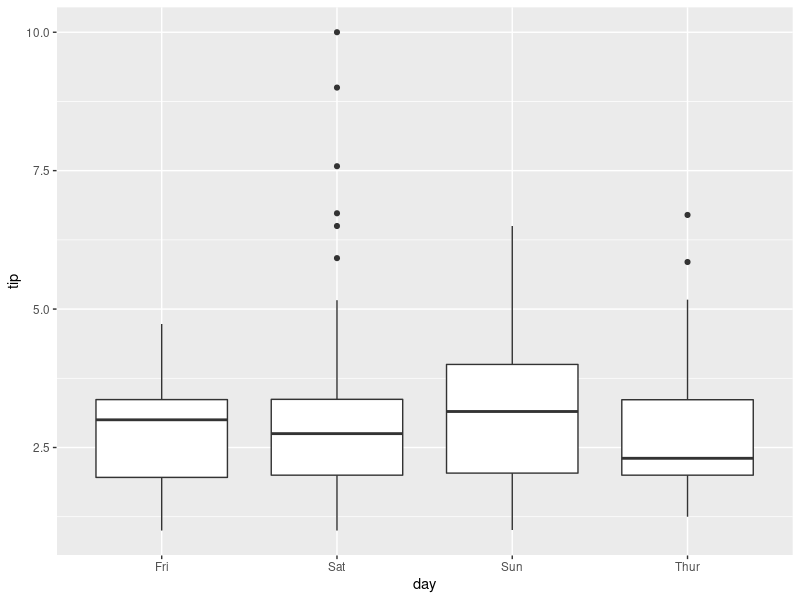
# a normal scatter plot problem
tips %>%
  ggplot() +
  geom_point(aes(x = day, y = tip))
Above code will generate the problem categorical scatter in above section.
In R you can use ggplot's geom_point() function like a normal scatter plot, but add an argument position.
# try a bee swarm plot
tips %>%
  ggplot() +
  geom_point(aes(x = day, y = tip, color = day), position = "jitter")
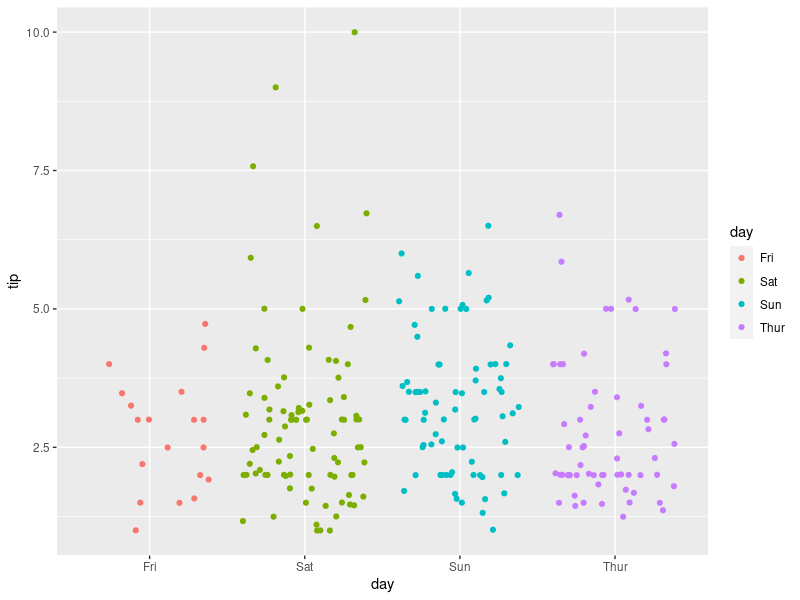
# try bee swarm plot with more information
tips %>%
  ggplot() +
  geom_point(aes(x = day, y = tip, color = smoker), position = "jitter")
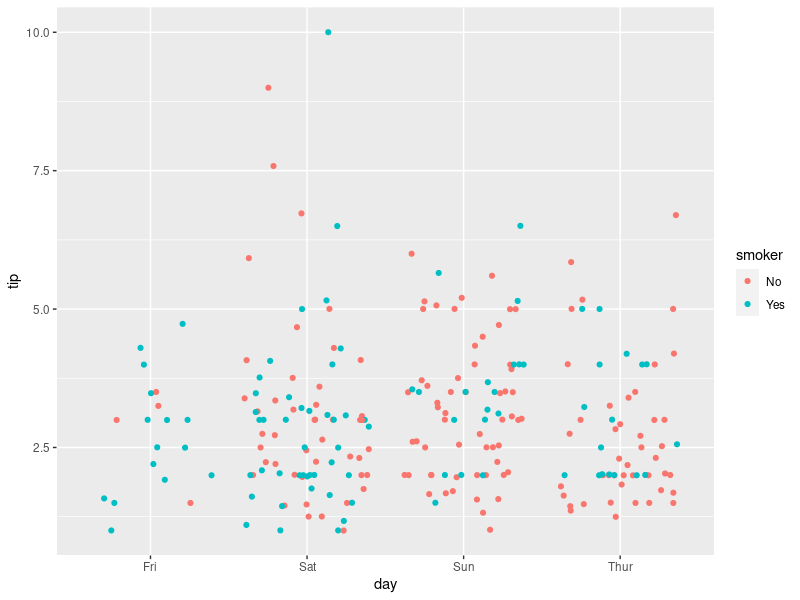
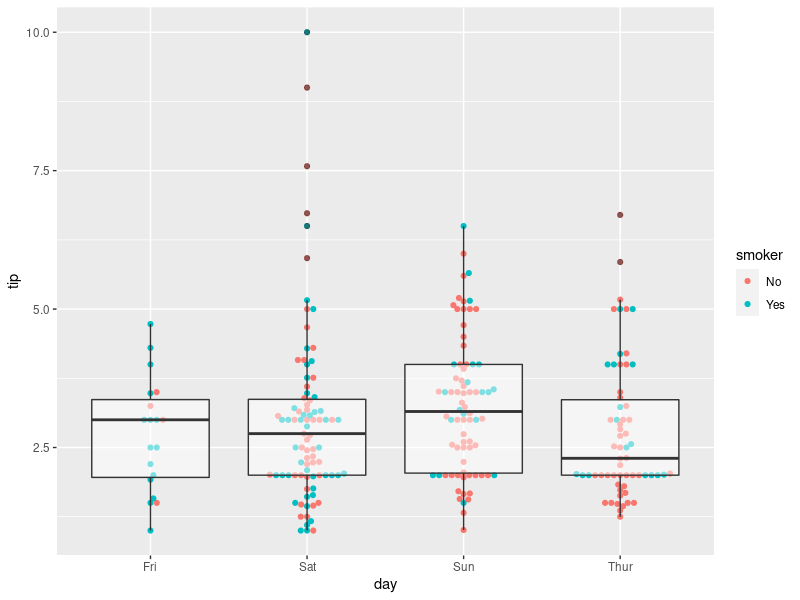
Of course, if you like boxplot's statistics indices, we can easily add a boxplot as a layer to it.
# try bee swarm plot with boxplot
tips %>%
  ggplot() +
  geom_point(aes(x = day, y = tip, color = smoker), position = "jitter") +
  geom_boxplot(aes(x = day, y = tip), alpha = 0.5)
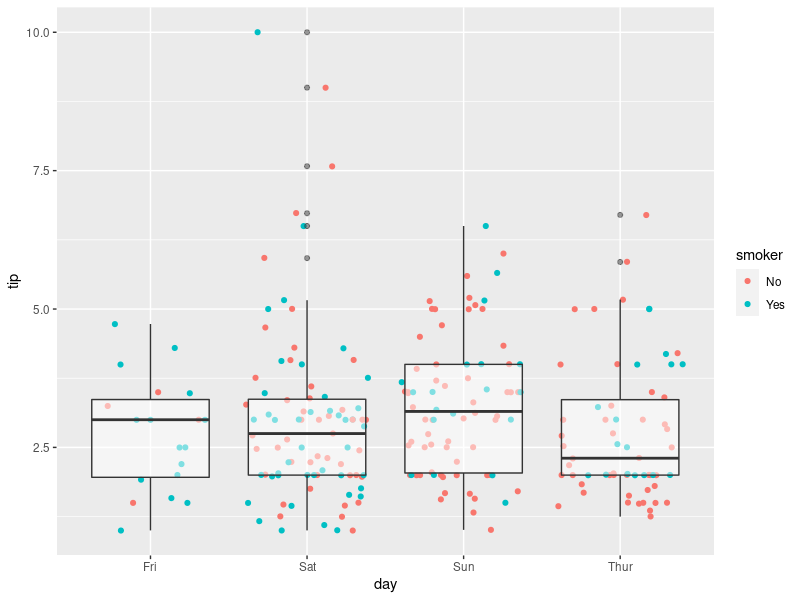
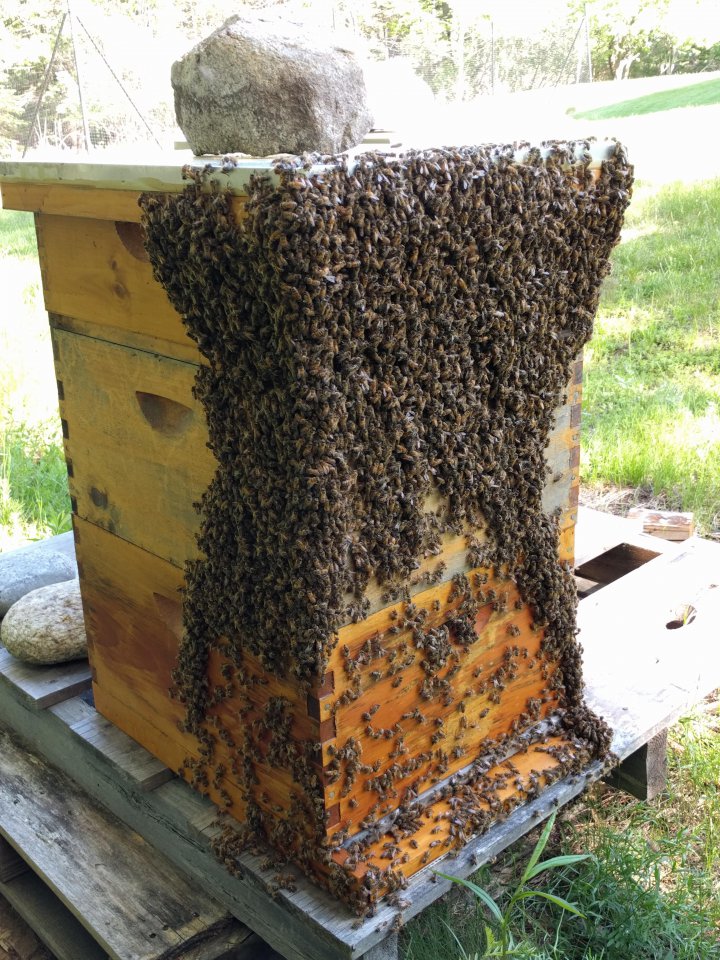
(One interesting thing is, bee swarm are often seen with a box as well, in the real world...)
First you need to install ggbeeswarm
# install.packages("ggbeeswarm")
# library(ggbeeswarm)
# another kind of bee swarm
tips %>%
  ggplot() +
  geom_beeswarm(aes(x = day, y = tip, color = smoker))
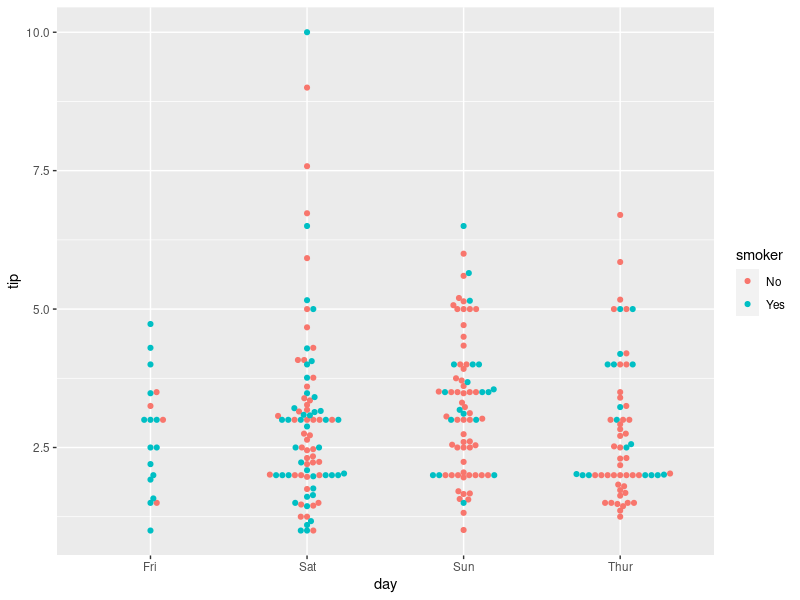
In some situation, this kind of bee swarm can save a layer of boxplot. Because it has already showed up some statistics indices. But it depends on your data and reader's background.
tips %>%
  ggplot() +
  geom_beeswarm(aes(x = day, y = tip, color = time)) +
  geom_boxplot(aes(x = day, y = tip), alpha = 0.5)
import seaborn as sns

sns.catplot(x = "day", y = "total_bill", hue = "sex", kind = "swarm", data = tips)
If you are interested in python/ seaborn, you can check it's official tutorial here: http://seaborn.pydata.org/tutorial/categorical.html

