
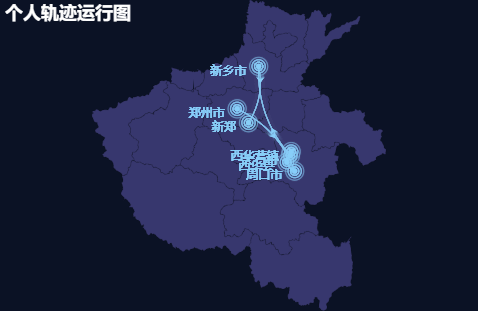
vue使用echarts绘制河南地图并实现个人轨迹
import echarts from 'echarts';
import "echarts/map/js/province/henan.js";
<div id="hndt" style="width: 100%;height: 50%;"></div>
轨迹数据没有贴完只有一个的其它的自己增加就行
 //使用echarts.init()方法初始化一个Echarts实例,在init方法中传入echarts map的容器 dom对象
      var mapChart = echarts.init(document.getElementById('hndt'));
      // mapChart的配置
      var option = {
backgroundColor: "#0b1225",
        title: {
          text: '个人轨迹运行图',
          left: 'left',
          textStyle: {
            color: '#fff'
          }
        },
        tooltip: {
          trigger: 'item'
        },
        dataRange: {
          show: false,
          min: 0,
          max: 1000,
          text: ['High', 'Low'],
          realtime: true,
          calculable: true,
          color: ['orangered', 'yellow', 'lightskyblue']
        },
        toolbox: {
          show : true,
          feature : {
            // dataView : {
            //   show: true,
            //   readOnly: true,
            // },
            restore : {show: true},
            saveAsImage : {show: true}
          }
        },
        visualMap: {
          show: true,
          min: 0,
          max: 255,
          calculable: true,
          inRange: {
            color: ['aqua', 'lime', 'yellow', 'orange', '#ff3333']
          },
          textStyle: {
            color: '#12223b'
          }
        },
        geo: { // 这个是重点配置区
          map: '河南', // 表示河南地图
          roam: true,
          layoutCenter: ['50%', '50%'],
          layoutSize: "100%",
          label: {
            normal: {
              show: false, // 是否显示对应地名
              textStyle: {
                color: 'rgba(94,239,27,0.95)'
              }
            },
          },
          itemStyle: {
            normal: {
              areaColor: '#37376e',
              borderColor: 'rgba(0, 0, 0, 0.2)'
            },
            emphasis: {
              areaColor: null,
              shadowOffsetX: 0,
              shadowOffsetY: 0,
              shadowBlur: 20,
              borderWidth: 0,
              shadowColor: 'rgba(0, 0, 0, 0.5)'
            }
          }
        },
        series: [
          {
            "type": "lines",
            "zlevel": 2,
            "effect": {
              "show": true,
              "period": 4,
              "trailLength": 0.02,
              "symbol": "arrow",
              "symbolSize": 5
            },
            "lineStyle": {
              "normal": {
                "width": 1,
                "opacity": 0.6,
                "curveness": 0.2
              }
            },
            "tooltip": {
              "trigger": "item"
            },
            "data": [
              {
                "fromName": "郑州市",
                "toName": "周口市",
                "value": 1,
                "coords": [
                  [
                    113.467,
                    34.623
                  ],
                  [
                    114.697,
                    33.625

                  ]
                ],
              },


          {
            "name": "地点",
            "type": "effectScatter",
            "coordinateSystem": "geo",
            "zlevel": 2,
            "rippleEffect": {
              "period": 4,
              "brushType": "stroke",
              "scale": 4
            },
            "tooltip": {
              "trigger": "item"
            },
            "label": {
              "normal": {
                "show": true,
                "position": "left",
                "offset": [
                  -5,
                  5
                ],
                "formatter": "{b}"
              },
              "emphasis": {
                "show": true
              }
            },
            "hoverAnimation": true,
            "symbol": "circle",
            "symbolSize": 5,
            "itemStyle": {
              "normal": {
                "show": false,
                "color": "#f00"
              }
            },
            "data": [
              {
                "name": "郑州市",
                "value": [
                  113.467,
                  34.623,
                  0
                ],
                tooltip:{
                  formatter:'时间:8:30am<br/>出发地:郑州市'
                },
              },
              {
                "name": "周口市",
                "value": [
                  114.697,
                  33.625,
                  1
                ]
              },
            ]
          },
        ]
  };
      //设置图表的配置项
      mapChart.setOption(option);
如果你不知道自己要去哪里,那么去哪里都是一样

 浙公网安备 33010602011771号