《数据分析实战-托马兹.卓巴斯》读书笔记第7章-时间序列技术(ARMA模型、ARIMA模型)
第7章探索了如何处理和理解时间序列数据,并建立ARMA模型以及ARIMA模型。注意:我在本章花的时间较长,主要是对dataframe结构不熟。
本章会介绍处理、分析和预测时间序列数据的各种技术。会学习以下技巧:
·在Python中如何处理日期对象
·理解时间序列数据
·*滑并转换观测值
·过滤时间序列数据
·移除趋势和季节性
·使用ARMA和ARIMA模型预测未来
7.1导论
时间序列随处可见;如果分析股票市场、太阳黑子,或河流,你就是在观察随时间延展的现象。数据科学家在职业生涯中处理时间序列数据总是不可避免的。本章中,我们会遇到对时间序列进行处理、分析和构建模型的多种技巧。
本章中用到的数据集来自网上河流的Web文档:http://ftp.uni-bayreuth.de/math/statlib/datasets/riverflow。这个文档本质上就是一个shell脚本,为本章创建数据集。要从文档中创建原始文件,你可以使用Windows下的Cygwin或者Mac/Linux下的Terminal,执行下述命令(假设你将文档保存在riverflows.webarchive):
/*
sh riverflows.webarchive
*/
邀月建议:安装cygwin巨麻烦,还是用安装好的CentOS虚拟机执行一下。
7.2在Python中如何处理日期对象
时间序列是以某个时间间隔进行采样得到的数据,例如,记录每秒的车速。拿到这样的数据,我们可以轻松估算经过的距离(假设观测值加总并除以3600)或者汽车的加速度(计算两个观测值之间的差异)。可以直接用pandas处理时间序列数据。
准备:需装好pandas、NumPy和Matplotlib。
步骤:从Web文档开始,我们进行清理,并形成两个数据集:美国河(http://www.theameri-canriver.com)和哥伦比亚河(http://www.ecy.wa.gov/programs/wr/cwp/cwpfactmap.html)。用pandas读取时间序列数据集很简单(ts_handlingData.py文件):
 1 import numpy as np
 2 import pandas as pd
 3 import pandas.tseries.offsets as ofst
 4 import matplotlib
 5 import matplotlib.pyplot as plt
 6
 7 # change the font size
 8 matplotlib.rc('xtick', labelsize=9)
 9 matplotlib.rc('ytick', labelsize=9)
10 matplotlib.rc('font', size=14)
11
12 # files we'll be working with
13 files=['american.csv', 'columbia.csv']
14
15 # folder with data
16 data_folder = '../../Data/Chapter07/'
17
18 # colors
19 colors = ['#FF6600', '#000000', '#29407C', '#660000']
20
21 # read the data
22 american = pd.read_csv(data_folder + files[0],
23     index_col=0, parse_dates=[0],
24     header=0, names=['','american_flow'])
25
26 columbia = pd.read_csv(data_folder + files[1],
27     index_col=0, parse_dates=[0],
28     header=0, names=['','columbia_flow'])
29
30 # combine the datasets
31 riverFlows = american.combine_first(columbia)
32
33 # periods aren't equal in the two datasets so find the overlap
34 # find the first month where the flow is missing for american
35 idx_american = riverFlows \
36     .index[riverFlows['american_flow'].apply(np.isnan)].min()
37
38 # find the last month where the flow is missing for columbia
39 idx_columbia = riverFlows \
40     .index[riverFlows['columbia_flow'].apply(np.isnan)].max()
41
42 # truncate the time series
43 riverFlows = riverFlows.truncate(
44     before=idx_columbia + ofst.DateOffset(months=1),
45     after=idx_american - ofst.DateOffset(months=1))
Tips:
/*
 Traceback (most recent call last):
  File "D:\Java2018\practicalDataAnalysis\Codes\Chapter07\ts_handlingData.py", line 49, in <module>
    o.write(riverFlows.to_csv(ignore_index=True))
TypeError: to_csv() got an unexpected keyword argument 'ignore_index'

D:\Java2018\practicalDataAnalysis\Codes\Chapter07\ts_handlingData.py:80: FutureWarning: how in .resample() is deprecated
the new syntax is .resample(...).mean()
  year = riverFlows.resample('A', how='mean')

 */
解决方案:
/*
# year = riverFlows.resample('A', how='mean')
year = riverFlows.resample('A').mean()

# o.write(riverFlows.to_csv(ignore_index=True))
  o.write(riverFlows.to_csv(index=True))
 */
原理:首先,我们引入所有必需的模块:pandas和NumPy。我们将得到两个文件:american.csv和columbia.csv。它们都位于data_folder。
我们使用已经熟悉的pandas的.read_csv(...)方法。先读入american.csv文件。指定index_col=0,让方法将第一列作为索引。要让pandas将某列当成日期处理,我们显式地命令.read_csv(...)方法将列作为日期解析(parse_dates)。
将两个文件合并成一个数据集。然后改动列名:我们告诉方法,这里没有头部,并且将自行提供名字。注意第一列不需要任何名字,它将被转换成索引。我们用同样的方式读入哥伦比亚河的数据。
读入两个文件后,将它们联系在一起。pandas的.combine_first(...)方法操作第一个数据集,插入哥伦比亚河数据集的列。
如果没有改变DataFrame的列名,.combine_first(...)方法将使用被调用DataFrame的数据来填充调用者DataFrame的空隙。
两个文件的时期不同,但是有重叠部分:美国河数据从1906年到1960年,哥伦比亚河数据从1933年到1969年。查看一下重叠的时期;我们连接的数据集只有1933年到1960年的数据。
首先,找到美国河没有数据的最早日期(american_flow列)。检查riverFlows的索引,选取american_flow值不是数字的所有日期;使用.apply(...)方法并使用NumPy的.isnan方法检查DataFrame的元素。做完这个之后,选取序列中的最小日期。
而对于columbia_flow,我们找的是没有数据的最晚日期。和处理美国河数据类似,我们先取出所有数据不是数字的日期,然后选取最大值。
.truncate(...)方法可以根据DatetimeIndex从DataFrame中移除数据。
DatetimeIndex是数字组成的不可变数组。内部由大整数表示,但看上去是日期-时间对象:既有日期部分也有时间部分的对象。
参考http://pandas.pydata.org/pandas-docs/stable/generated/pandas.DatetimeIndex.html。
我们向.truncate(...)方法传递两个参数。before参数指定了要舍弃哪个日期之前的记录,after参数指定了保留数据的最后一个日期。
idx_...对象保存了至少有一列没有数据的日期的最小值和最大值。不过,如果将这些日期传入.truncate(...)方法,我们也会选出同样没有数据的极值点。应对这种情况,我们用.DateOffset(...)方法将日期移个位。我们只挪一个月。
如果想更深入了解.DateOffset(...)方法,可参考http://pandas.pydata.org/pandas-docs/stable/timeseries.html#dateoffset-objects。
最后将连接后的数据集保存到文件。(更多信息参考本书1.2节)

/*
Index of riverFlows
DatetimeIndex(['1933-01-31', '1933-02-28', '1933-03-31', '1933-04-30',
               '1933-05-31', '1933-06-30', '1933-07-31', '1933-08-31',
               '1933-09-30', '1933-10-31',
               ...
               '1960-03-31', '1960-04-30', '1960-05-31', '1960-06-30',
               '1960-07-31', '1960-08-31', '1960-09-30', '1960-10-31',
               '1960-11-30', '1960-12-31'],
              dtype='datetime64[ns]', name='', length=336, freq=None)

csv_read['1933':'1934-06']
            american_flow  columbia_flow

1933-01-31        10.7887          24.10
1933-02-28        14.6115          20.81
1933-03-31        19.6236          22.96
1933-04-30        21.9739          37.66
1933-05-31        28.0054         118.93
1933-06-30        66.0632         331.31
1933-07-31       113.4373         399.27
1933-08-31       162.0007         250.89
1933-09-30       156.6771         116.10
1933-10-31        17.9246          69.38
1933-11-30         7.0792          52.95
1933-12-31         4.0493          40.21
1934-01-31        11.5816          35.40
1934-02-28        18.5192          28.88
1934-03-31        53.8586          33.41
1934-04-30        75.8608         102.22
1934-05-31        89.3963         259.67
1934-06-30       116.2973         390.77

Shifting one month forward
            american_flow  columbia_flow

1933-02-28        10.7887          24.10
1933-03-31        14.6115          20.81
1933-04-30        19.6236          22.96
1933-05-31        21.9739          37.66
1933-06-30        28.0054         118.93
1933-07-31        66.0632         331.31

Shifting one year forward
            american_flow  columbia_flow

1934-01-31        10.7887          24.10
1934-02-28        14.6115          20.81
1934-03-31        19.6236          22.96
1934-04-30        21.9739          37.66
1934-05-31        28.0054         118.93
1934-06-30        66.0632         331.31

Averaging by quarter
            american_flow  columbia_flow

1933-03-31      15.007933      22.623333
1933-06-30      38.680833     162.633333

Averaging by half a year
            american_flow  columbia_flow

1933-01-31      10.788700      24.100000
1933-07-31      43.952483     155.156667

Averaging by year
            american_flow  columbia_flow

1933-12-31      51.852875     123.714167
1934-12-31      44.334742     128.226667 */
更多:从时间序列DataFrame中选取数据很直接:你仍然可以使用已知的DataFrame取子集的方法(比如,使用元素索引的riverFlows[0:10]或者.head(...)方法)。不过,有了DataFrame和DatetimeIndex索引,你也可以传日期:
print(riverFlows['1933':'1934-06'])
这行命令会打印出1933年到1934年6月的所有记录。注意,尽管有每月的数据,我们依然可以传入一个年份;pandas会选取相应的观测值。
有时候,你需要时间*移后的观测值,比如,测量仪的内部时钟没调整好,导致观测值偏了一小时,或者一个人为错误让观测值偏了一年。这可以用.shift(...)方法轻松纠正:
1 # shifting the data
2 by_month = riverFlows.shift(1, freq='M')
3 by_year = riverFlows.shift(12, freq='M')
传给.shift(...)方法的第一个参数指定了要偏移的数字,freq参数指定了频率(本例中是一个月)。
有时,你想在季末或年末时计算*均值(或总和)。可通过.resample(...)方法轻松做到:
1 # averaging by quarter
2 quarter = riverFlows.resample('Q').mean()
3 # averaging by half a year
4 half = riverFlows.resample('6M').mean()
5 # averaging by year
6 year = riverFlows.resample('A').mean()
第一个参数定义了频率:Q意味着季末(三月、六月、九月和十二月),how指定了怎么处理观测值(本例中使用mean,因为对我们的数据来说*均值比较有意义,但如果要处理销售额数据,你也许会指定sum)。
A是年末,6M是半年末,即十二月和六月。
另外,pandas可轻松绘制时间序列的图:
 1 import matplotlib
 2 import matplotlib.pyplot as plt
 3 matplotlib.rc('font', size=14)
 4
 5 # colors
 6 colors = ['#FF6600', '#000000', '#29407C', '#660000']
 7
 8 # plot time series
 9 # monthly time series
10 riverFlows.plot(title='Monthly river flows', color=colors)
11 plt.savefig(data_folder + '/charts/monthly_riverFlows.png',
12     dpi=300)
13 plt.close()
先引入Matplotlib模块,更改x轴和y轴的数字与标题。
Matplotlib的配置项可参考http://matplotlib.org/users/customizing.html。
然后指定颜色;这个常量在所有图表中都会用到。
.plot(...)方法绘图。我们定义标题,允许方法从颜色列表中挑选颜色。最后,将图保存到文件并关闭,以释放内存。
月度和季度图表如下: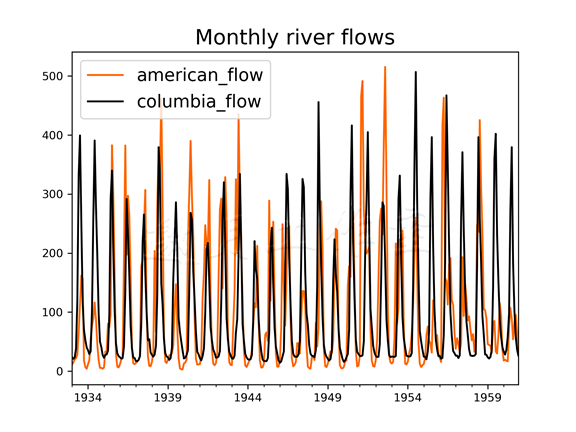
查看月度图表,你也许会觉得两条河的流动没什么变化;而季度图则展示了不同之处: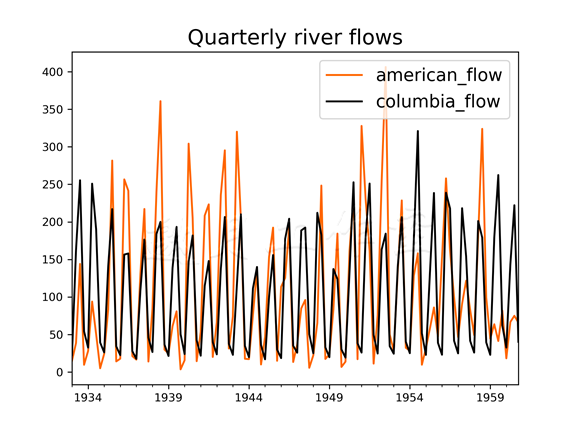
理解时间序列数据
希望从数据集中看出什么时,一件基本事实是:如果不理解你要处理的数据,你不可能构建一个成功的统计模型。
准备:需装好pandas、Statsmodels和Matplotlib。
步骤:
处理时间序列的基本统计方法是ACF(autocorrelation function,自相关函数)、PACF(partial autocorrelation function,偏自相关函数)和谱密度(ts_timeSeriesFunctions.py文件):
 1 # time series tools
 2 import statsmodels.api as sm
 3
 4 # read the data
 5 riverFlows = pd.read_csv(data_folder + 'combined_flow.csv',
 6     index_col=0, parse_dates=[0])
 7
 8 # autocorrelation function
 9 acf = {}    # to store the results
10 f = {}
11
12 for col in riverFlows.columns:
13     acf[col] = sm.tsa.stattools.acf(riverFlows[col])
14
15 # partial autocorrelation function
16 pacf = {}
17
18 for col in riverFlows.columns:
19     pacf[col] = sm.tsa.stattools.pacf(riverFlows[col])
20
21 # periodogram (spectral density)
22 sd = {}
23
24 for col in riverFlows.columns:
25     sd[col] = sm.tsa.stattools.periodogram(riverFlows[col])
原理:为了节省篇幅,我们这里省略了引入和声明变量的步骤。细节可查看源文件。
首先,以类似的方式读入(我们在之前的技巧里创建的)数据集,不过不指定变量的名字,而是用.read_csv(...)方法从文件的第一行获取。
然后计算ACF。ACF体现了t时刻的观测值与t+lag时刻的观测值的关联有多强,这里lag是时间间隔。在本书后续部分(使用ARMA和ARIMA模型预测未来),我们会使用ACF函数计算ARMA(或ARIMA)模型的MA(moving average,移动*均)。在这里用Statsmodels模型的.acf(...)方法计算时间序列的ACF值。.acf(...)方法的nlags参数,默认值是40,我们就用默认值。
在给定了以往延迟的条件下,PCAF可以看成是对当前观测值的回归。我们用PACF曲线得到ARMA(或ARIMA)模型的AR(auto-regressive,自回归)。使用Statsmodels模型的.pacf(...)方法计算时间序列的PACF值。
如果对ACF和PACF感兴趣的话,你可以参考https://onlinecourses.science.psu.edu/stat510/node/62。
最后计算周期图法,这个方法可以帮我们找到数据中的基础频率,即数据中波峰和波谷的主频率。
让我们来绘制该图:
 1 # plot the data
 2 fig, ax = plt.subplots(2, 3) # 2 rows and 3 columns
 3
 4 # set the size of the figure explicitly
 5 fig.set_size_inches(12, 7)
 6
 7 # plot the charts for American
 8 ax[0, 0].plot(acf['american_flow'], colors[0])
 9 ax[0, 1].plot(pacf['american_flow'],colors[1])
10 ax[0, 2].plot(sd['american_flow'],  colors[2])
11 ax[0, 2].yaxis.tick_right() # shows the numbers on the right
12
13 # plot the charts for Columbia
14 ax[1, 0].plot(acf['columbia_flow'], colors[0])
15 ax[1, 1].plot(pacf['columbia_flow'],colors[1])
16 ax[1, 2].plot(sd['columbia_flow'],  colors[2])
17 ax[1, 2].yaxis.tick_right()
18
19 # set titles for columns
20 ax[0, 0].set_title('ACF')
21 ax[0, 1].set_title('PACF')
22 ax[0, 2].set_title('Spectral density')
23
24 # set titles for rows
25 ax[0, 0].set_ylabel('American')
26 ax[1, 0].set_ylabel('Columbia')
首先,我们创建了一个图表,将以两行三列的方式放6个子图。我们显式地指定图表的大小。
下面画图。ax是放坐标轴对象的NumPy数组;在我们的例子中,这是个二维数组。通过指定对象的坐标,我们指定图表的位置(0,0是左上角)。
行中的最后一个图表,我们通过调用.yaxis.tick_right()方法设置y轴的数字,展示在图表的右侧。
我们只在绘制ACF、PACF和谱密度时设定图表标题。对于行,我们指定y轴的标签,以区分不同的河流。
绘制出的图表如下: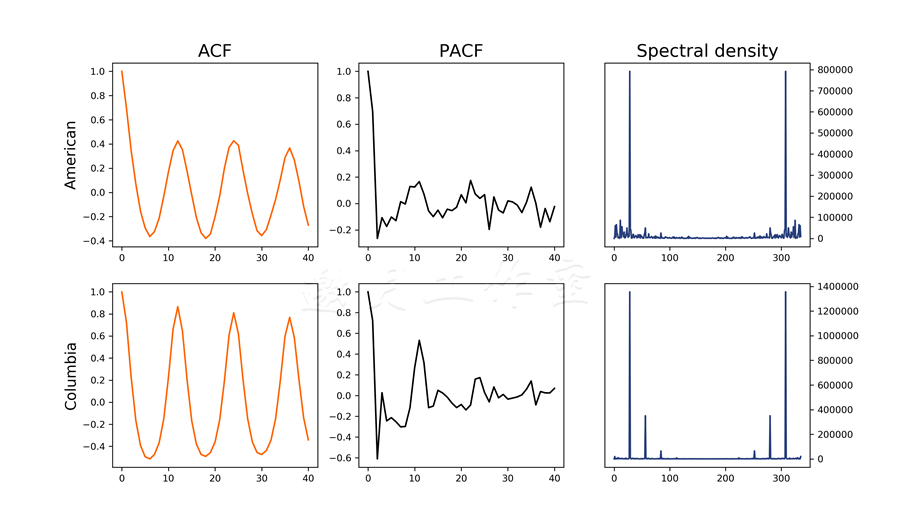
Tips:
你会发现ACF图表中有一个重复的模式。这暗示着我们的数据(如预期般)是周期性的(年度周期模式)。这也暗示着我们的处理过程是不*稳的。
*稳过程指的是,方差和联合概率不随时间变化(http://www.itl.nist.gov/div898/handbook/pmc/section4/pmc442.htm)。
PACF展示了,时刻t的观测值强烈依赖于时刻t-1和t-2的观测值(对更之前的快照依赖较少)。分析谱密度可知基础频率大约在29;即,每29个月会重复一个基本的模式。这出乎我们的意料,我们本以为序列重复的间隔会是12的倍数。这可能是多种因素的影响:错误记录的观测值,错误的设备,或者某些观测年发生的基本偏移模式。
更多:之前ACF和PACF的图表并不容易得到置信区间的主要偏差:这些偏差让我们很容易辨别出时间序列过程的AR和MA。
不过,Statsmodels提供了便捷的函数.plot_acf(...)和.plot_pacf(...)(ts_timeSeries Functions_alternative.py文件):
 1 # plot the data
 2 fig, ax = plt.subplots(2, 2, sharex=True)
 3
 4 # set the size of the figure explicitly
 5 fig.set_size_inches(8, 7)
 6
 7 # plot the charts for american
 8 sm.graphics.tsa.plot_acf(
 9     riverFlows['american_flow'].squeeze(),
10     lags=40, ax=ax[0, 0])
11
12 sm.graphics.tsa.plot_pacf(
13     riverFlows['american_flow'].squeeze(),
14     lags=40, ax=ax[0, 1])
15
16 # plot the charts for columbia
17 sm.graphics.tsa.plot_acf(
18     riverFlows['columbia_flow'].squeeze(),
19     lags=40, ax=ax[1, 0])
20
21 sm.graphics.tsa.plot_pacf(
22     riverFlows['columbia_flow'].squeeze(),
23     lags=40, ax=ax[1, 1])
24
25 # set titles for rows
26 ax[0, 0].set_ylabel('American')
27 ax[1, 0].set_ylabel('Columbia')
首先创建图表,可容纳4个子图(放在2×2的网格上)。将sharex参数设置为True意味着图表的坐标轴对象有相同的时域。我们也显式指定图表大小。
.plot_acf(...)方法和.plot_pacf(...)方法都以用来绘图的数据作为第一个参数。.squeeze()方法将单列的DataFrame转换为一个序列对象。这里,我们显式指定时间间隔。ax参数指定了图表放置的位置。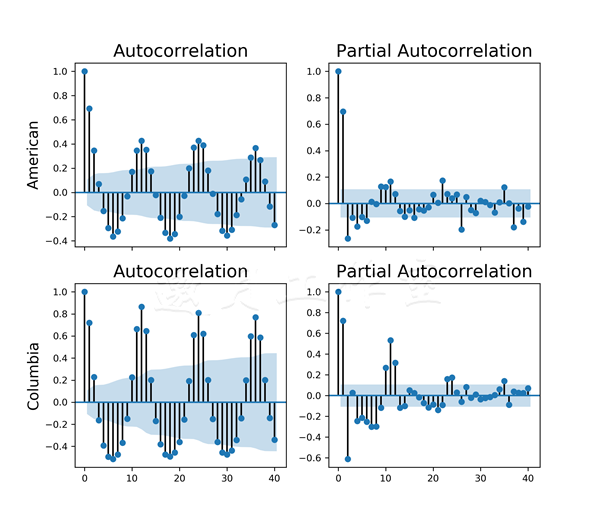
7.4*滑并转换观测值
顾名思义,*滑数据就是移除数据中的噪音,使得图表更为*滑。
那你该这么做吗?从展示的角度说,当然!从建模的角度看,不是必需的——参考William Briggs在http://wmbriggs.com/post/195/的论述。
准备:需装好pandas、NumPy和Matplotlib。
步骤:本技巧中,我们将介绍如何计算移动*均和用对数函数转换数据(ts_smoothing.py文件):
1 ma_transform12  = pd.rolling_mean(riverFlows, window=12)
2 ma_transformExp = pd.ewma(riverFlows, span=3)
3 log_transfrom   = riverFlows.apply(np.log)
原理:pandas的.rolling_mean(...)方法计算移动*均数。这个方法对时刻>t<与时刻>(t+window-1)<之间的观测值计算*均数,并用这个*均数替代时刻>t<的观测值。你也可以不取window-1个之前的观测值,而是指定center参数,这样会在时刻t两边取同样数目的观测值。
.ewma(...)方法使用一个指数衰减的函数来*滑数据。span参数控制影响窗口——计算加权*均时还有多少相关的观测值。
如果要更了解这些技巧,可以学习pandas的文档:http://pandas.pydata.org/pandas-docs/stable/computation.html#exponentially-weighted-moment-functions。
对数据做对数转换有利于计算,有时候转换后也能看出更多模式。和*滑不同,这是一个可逆的过程,所以我们不会损失精确度(只要你不做进一步的转换,比如,计算对数转换后的移动*均)。这里,我们使用NumPy库里的.log方法。它取用时刻t的观测值,和window-1个之前的观测值,计算其*均数,并用得到的值替换时刻t的观测值。
得到的图表展示了技巧将原始的数据集变得多么不同: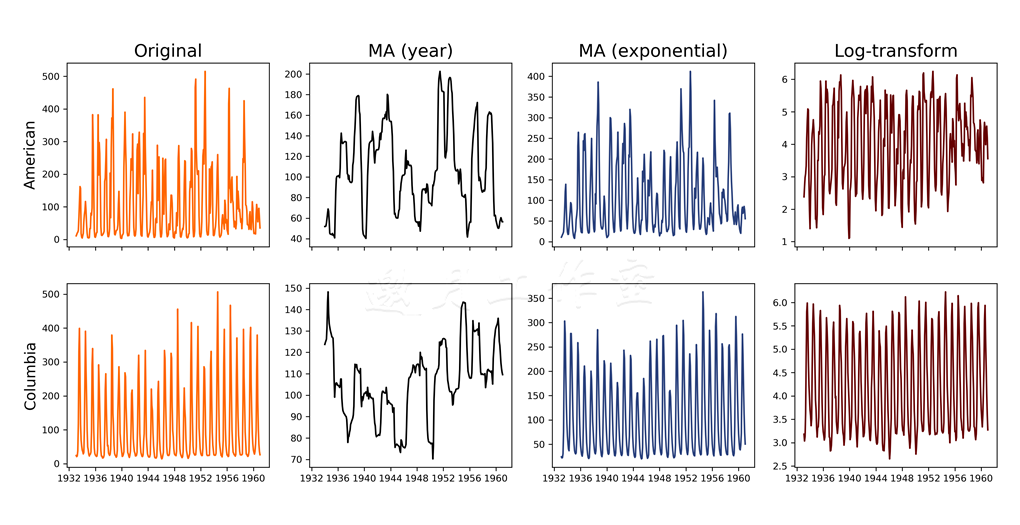
MA*滑技巧移除了很多噪音,揭示了数据中的局部趋势;对美国河而言,水位从开始到1942年左右是上升的,然后直到1950年都是下降的,之后又是有升有降。而对于哥伦比亚河,你可以看到一开始的下降趋势,1945年左右才翻转过来。
指数*滑不像MA这么天然,它只移除数据中最大的波峰,同时保留其整体形状。log变换将数据的幅度正规化。前面提到过,这是唯一一个完全可逆的技巧,不用担心数据丢失。
更多:Holt变换是另一个指数*滑的例子。区别在于它不对smoothing参数取幂(ts_smoothing_alternative.py文件):
 1 import pandas as pd
 2 import numpy as np
 3
 4 def holt_transform(column, alpha):
 5     '''
 6         Method to apply Holt transform
 7
 8         The transform is given as
 9         y(t) = alpha * x(t) + (1-alpha) y(t-1)
10     '''
11     # create an np.array from the column
12     original = np.array(column)
13
14     # starting point for the transformation
15     transformed = [original[0]]
16
17     # apply the transform to the rest of the data
18     for i in range(1, len(original)):
19         transformed.append(
20             original[i] * alpha +
21             (1-alpha) * transformed[-1])
22
23     return transformed
*滑后时刻t的值由其观测值与之前*滑后的值决定;每个观测值的影响由alpha参数控制。
我们先创建一个NumPy数组。变换的起点是初始的观测值。然后遍历数组中所有的观测值,应用处理逻辑。
这里使用Holt*滑法,alpha设为0.5:
# transformations
ma_transformHolt = riverFlows.apply(
    lambda col: holt_transform(col, 0.5), axis=0)
axis设为0时,.apply(...)方法将列逐一传入holt_transform(...)方法。
我们也可以进行差分处理,这样可快速移除数据的趋势,使其稳定;差分是计算时刻t及其前导(时刻t-1)观测值之差的方法:
difference = riverFlows - riverFlows.shift()
这里,我们使用了之前在7.2节中解释过的.shift(...)方法。
得到的变换如下所示: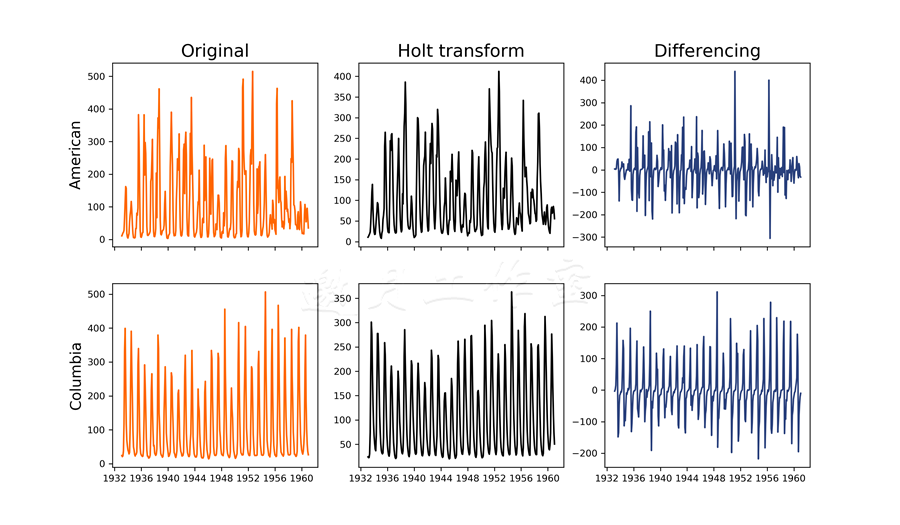
真心赞一个!
可以看出,如同指数*滑一样,这个方法也移除了大部分噪音,但保留了数据的形状。如果相比于时间序列中的值本身,你更关心预测变化,那么差分是很有用的;预测股市变化就是一个应用场景。
7.5过滤时间序列数据
通过*滑移除噪音只是技巧之一。本技巧中,我们看看如何通过卷积及其他滤波器从数据中提取某些频率。
准备:需装好pandas、Statsmodels、NumPy、Scipy和Matplotlib。
步骤:
简单来说,卷积就是f函数(我们的时间序列)和g函数(我们的滤波器)的交叠。卷积模糊了时间序列(从这个角度,也可以将其看成一个*滑技巧)。
这里有一个不错的对卷积的介绍:http://www.songho.ca/dsp/convolution/convolution.html。
下面的代码在ts_filtering.py中:
 1 # prepare different filters准备不同的滤波器
 2 MA_filter = [1] * 12
 3 linear_filter = [d * (1 / 12) for d in range(0, 13)]
 4 gaussian = [0] * 6 + list(sc.signal.gaussian(13, 2)[:7])
 5
 6 # convolve卷积
 7 conv_ma = riverFlows.apply(
 8     lambda col: sm.tsa.filters.convolution_filter(
 9         col, MA_filter), axis=0).dropna()
10
11 conv_linear = riverFlows.apply(
12     lambda col: sm.tsa.filters.convolution_filter(
13         col, linear_filter), axis=0).dropna()
14
15 conv_gauss = riverFlows.apply(
16     lambda col: sm.tsa.filters.convolution_filter(
17         col, gaussian), axis=0).dropna()
原理:
第一个滤波器,我们通过卷积可以实现一个移动*均(MA)滤波器:这个滤波器是由12个元素组成的列表,每个元素都是1。
第二个滤波器在12个周期内线性增长;这个滤波器逐步降低输出值中旧观测值的重要性。
最后一个滤波器使用高斯函数过滤数据。
这些滤波器的响应看上去像这样: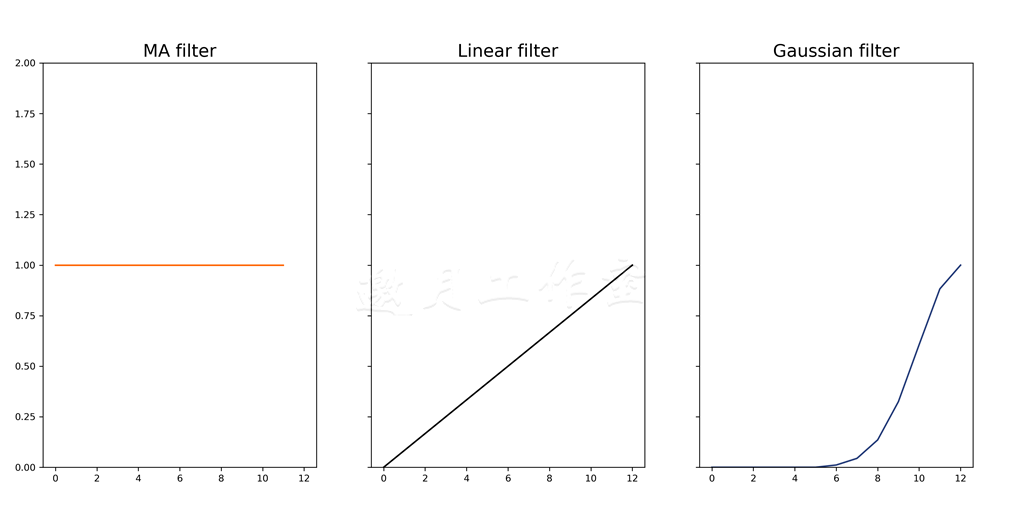
我们使用Statsmodels的.convolution_filter(...)方法过滤数据集。这个方法将数据作为第一个参数及过滤数组。
对有些观测值,方法本身并不能为其生成任何结果,所以我们使用.dropna()移除缺失的观测值。过滤后的数据集如下所示: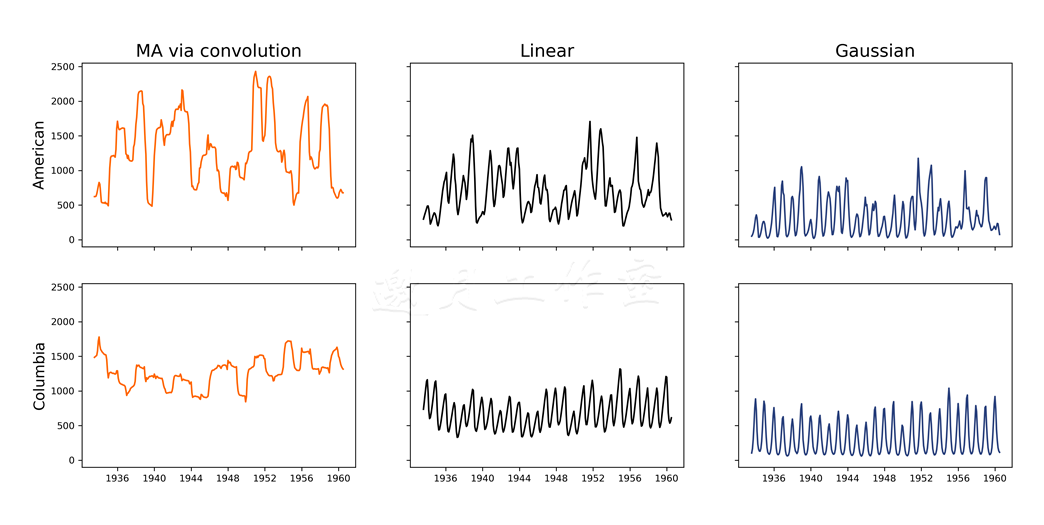
通过卷积的MA产生了和之前的.rolling_mean(...)方法同样的结果。线性滤波器从数据集中移除波峰。最后,高斯模糊不仅减少了观测值的幅度,而且让其更*滑。
更多:对于经济数据(或者像我们的例子,自然中的数据),某些滤波器会更合适:比如BK(Baxter-King)、HP(Hodrick-Prescott)与CF(Christiano-Fitzgerald)。
如果有兴趣,可以查看相关的学术论文:http://www.nber.org/papers/w5022.pdf(Baxter-King),
https://www0.gsb.columbia.edu/faculty/rhodrick/prescott-hodrick1997.pdf(Hodrick-Prescott)
与http://www.nber.org/papers/w7257.pdf(Christiano-Fitzgerald)。
我们使用Statsmodels实现这些滤波器:
bkfilter = sm.tsa.filters.bkfilter(riverFlows, 18, 96, 12)
hpcycle, hptrend = sm.tsa.filters.hpfilter(riverFlows, 129600)
cfcycle, cftrend = sm.tsa.filters.cffilter(riverFlows,
    18, 96, False)
BK过滤器是一个带通滤波器;从时间序列中移除高频和低频。.bkfilter(...)方法以数据作为第一个参数。下一个参数是振动的最小周期;对于月度数据,推荐使用18,季度推荐使用6,年度推荐使用1.5。下一个参数定义了振动的最大周期:对于月度数据,推荐使用96。最后一个参数决定了滤波器的超前-滞后(或者说,一个窗口)。
HP过滤器通过解决一个最小化问题,将初始的时间序列拆成趋势和业务周期组件。.hpfilter(...)方法以数据作为第一个参数及*滑的参数。通常,对季度数据使用1600作为频率,年度数据使用6.25,月度数据(即本例中)使用129600。
CF过滤器将初始的时间序列拆成趋势和业务周期组件,在这个意义上来说,和HP过滤器类似。.cffilter(...)也是以数据作为第一个参数。与BK过滤器类似,接下来两个参数指定了振动的最小周期和最大周期。最后一个参数drift指定了是否要从数据中移除趋势。
过滤后的数据如下: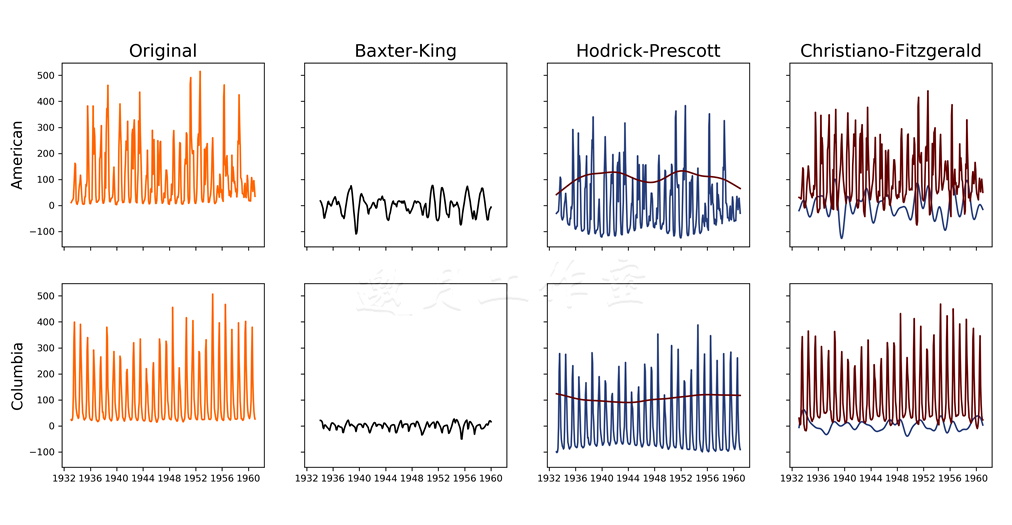
BK过滤器从数据中移除幅度,并使其静止。分析HP过滤器的输出可以看出,哥伦比亚河的长期趋势几乎是恒定的,而美国河的趋势一直在变。美国河的周期组件也体现了类似的模式。CF过滤器的输出证明了这一点:美国河的趋势组件比哥伦比亚河的更多变。
7.6移除趋势和季节性
如同之前提到的,时间序列是*稳的等价条件,并且其*均值、方差和自相关都不随时间变化。这意味着,有趋势和季节性的时间过程就是不*稳的。
下一个技巧要介绍的ARMA模型和ARIMA模型要求数据是*稳的(或接**稳)。所以,本技巧中,我们学习如何从河水流动数据中移除趋势和季节性。
准备:需装好pandas、NumPy、Statsmodels和Matplotlib。
步骤:Statsmodels提供了方便的移除趋势和季节性的方法(ts_detrendAndRemoveSeasonality.py文件):
 1 import pandas as pd
 2 import numpy as np
 3 import matplotlib
 4 import matplotlib.pyplot as plt
 5
 6 # change the font size
 7 matplotlib.rc('xtick', labelsize=9)
 8 matplotlib.rc('ytick', labelsize=9)
 9 matplotlib.rc('font', size=14)
10
11 # time series tools
12 import statsmodels.api as sm
13
14 def period_mean(data, freq):
15     '''
16         Method to calculate mean for each frequency
17     '''
18     return np.array(
19         [np.mean(data[i::freq]) for i in range(freq)])
20
21 # folder with data
22 data_folder = '../../Data/Chapter07/'
23
24 # colors
25 colors = ['#FF6600', '#000000', '#29407C', '#660000']
26
27 # read the data
28 # riverFlows = pd.read_csv(data_folder + 'combined_flow.csv',
29 #     index_col=0, parse_dates=[0])
30 riverFlows = pd.read_csv(data_folder + 'combined_flow.csv')
31
32
33 # detrend the data
34 detrended = sm.tsa.tsatools.detrend(riverFlows,
35     order=1, axis=0)
36
37 # create a data frame with the detrended data
38 detrended = pd.DataFrame(detrended, index=riverFlows.index,
39     columns=['american_flow_d', 'columbia_flow_d'])
40
41 # join to the main dataset
42 riverFlows = riverFlows.join(detrended)
43
44 # calculate trend
45 riverFlows['american_flow_t'] = riverFlows['american_flow'] \
46     - riverFlows['american_flow_d']
47 riverFlows['columbia_flow_t'] = riverFlows['columbia_flow'] \
48     - riverFlows['columbia_flow_d']
49
50 # number of observations and frequency of seasonal component
51 nobs = len(riverFlows)
52 freq = 12   # yearly seasonality
53
54 # remove the seasonality
55 for col in ['american_flow_d', 'columbia_flow_d']:
56     period_averages = period_mean(riverFlows[col], freq)
57     riverFlows[col[:-2]+'_s'] = np.tile(period_averages,
58         nobs // freq + 1)[:nobs]
59     riverFlows[col[:-2]+'_r'] = np.array(riverFlows[col]) \
60         - np.array(riverFlows[col[:-2]+'_s'])
原理:首先,我们读入数据。
使用Statsmodels的.detrend(...)方法,我们从数据中移除趋势。order参数指定了趋势的类型:0代表常数,1代表趋势是线性的,2代表要移除的是一个二次趋势。
.detrend(...)方法返回一个NumPy数组;在我们的例子中,这是一个二维数组,因为初始的数据集中有两列。所以,为了便于加入初始数据集,下一步我们用移除趋势的数据创建一个DataFrame。我们重用了初始DataFrame的索引:riverFlows。而且,为了避免和初始数据集冲突,列名加上后缀_d。
pandas的.join(...)方法(默认情况下)根据索引合并两个DataFrame:匹配两个DataFrame的索引,返回对应的值。不过,.join(...)方法给你控制权,允许你指定要连接到的列;键-列在两个数据集中都要有。它也允许你指定如何连接DataFrame:默认情况下,这是个左连接,从调用方DataFrame的每行记录出发,连接传入DataFrame中键名匹配的所有值;由于两个DataFrame中索引相同,我们只需要调用这个方法即可。
要理解其他类型的连接,参考http://www.sql-join.com。原作者也推荐查看.join(...)方法的文档:http://pandas.pydata.org/pandas-docs/stable/generated/pandas.DataFrame.join.html。
得到的时间序列和初始的并没有太大差别:
/* 错,生成空白!!!! */
解决方案:
/*
# create a data frame with the detrended data
#用移除趋势的数据创建一个DateFrame
# detrended = pd.DataFrame(detrended, index=riverFlows.index,
#     columns=['american_flow_d', 'columbia_flow_d'])
#原方法中列'american_flow_d', 'columbia_flow_d'都是NaN
detrended.rename(columns={'american_flow':'american_flow_d', 'columbia_flow':'columbia_flow_d'}, inplace = True)
  */
趋势就是初始值与去趋势化之后的值之间的差别。
去趋势化时间序列之后,我们可以计算季节性组件。我们期望得到的是一个年度季节性,所以freq被设为12。这意味着我们期望每12个月会重复一个模式。period_mean(...)方法就是计算这个的。data[i::freq]选取第i个观测值,并在第i个之后,每隔12个(freq)选取观测值,动态创建列表。
子集语法d[f:l:freq]指定了第一个位置f,最后一个位置l,以及取样的频率freq。假设d=[1,2,3,4,5,6,7,8,9,10]和d[1::2],我们会得到[2,4,6,8,10]。
NumPy的.mean(...)方法计算数组中所有元素的*均值。对于每条河流,我们得到下面的结果: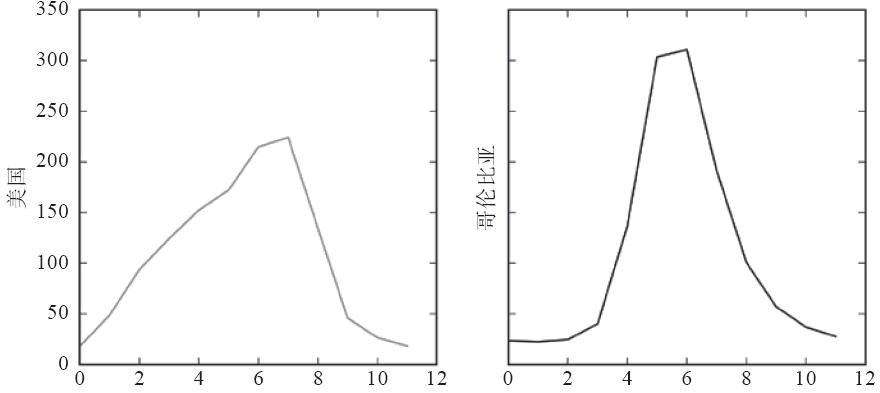
美国河看起来更柔顺:八月份左右逐渐涨到顶峰,然后越到年末越回落。相反,哥伦比亚河一年中大部分都很*静,到夏季突然涨得厉害。
计算了季节性的*均,我们可以从去趋势化后的数据中提取出来。我们使用NumPy的.tile(...)方法针对时间序列的长度重复季节模式。这个方法以要重复的模式作为第一个参数。第二个参数指定模式要重复多少次。
//操作符做的是整数除法,将得到的商圆整到最*的整数。
最后,我们计算移除季节性后的残差:
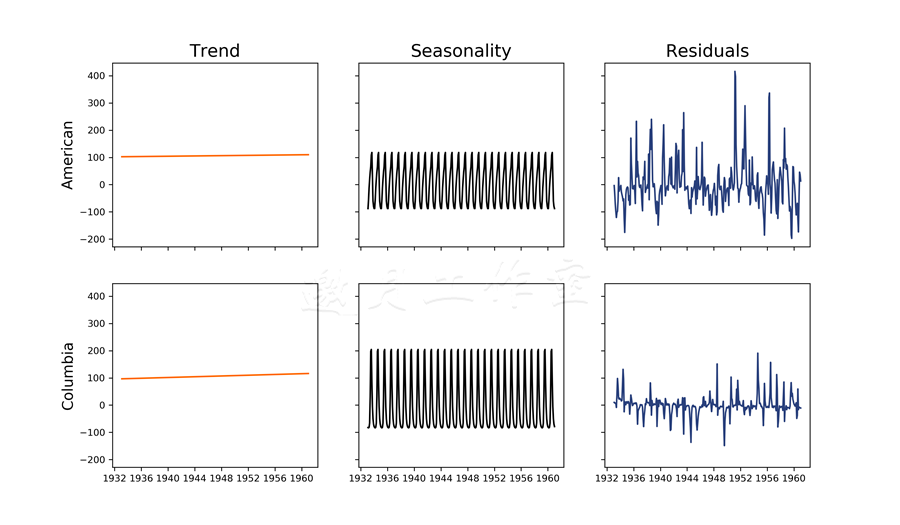
这里,我们将时间序列分解成一个线性趋势、季节性组件以及残差。可以看出,两条河的流量都随着时间增长,但是增长可忽略。我们可以清楚地看出(期望中的)年度模式,哥伦比亚河的方差更大。对于残差,美国河变化的幅度要显著高于哥伦比亚河。
更多:
Statsmodels有另一个分解时间序列的有用方法:.seasonal_decompose(...)。
不幸的是,Statsmodels的文档是缺失的;项目只在发布笔记中提到了.seasonal_decompose(...)方法,举了一个例子,而文档是找不到的。学习GitHub上的源代码,可以发现更多内容,作者推荐你也这么做(https://github.com/statsmodels/statsmodels/blob/master/statsmodels/tsa/seasonal.py。
这个方法以要分解的数据作为第一个参数。你可以指定基础模型的类型:可加的(我们的例子)或可乘的(传入m)。你也可以指定freq参数;这个参数可不传,频率也能通过数据推断出。
关于可加和可乘的分解模型的区别,推荐阅读https://onlinecourses.science.psu.edu/stat510/node/69。
方法返回一个DecomposeResult对象。要访问分解的组件,可调用对象的属性(ts_seasonalDecomposition.py):
 1  for col in riverFlows.columns:
 2     # seasonal decomposition of the data
 3     sd = sm.tsa.seasonal_decompose(riverFlows[col],
 4         model='a', freq=12)
 5
 6     riverFlows[col + '_resid'] = sd.resid \
 7         .fillna(np.mean(sd.resid))
 8
 9     riverFlows[col + '_trend'] = sd.trend \
10         .fillna(np.mean(sd.trend))
11
12     riverFlows[col + '_seas'] = sd.seasonal \
13         .fillna(np.mean(sd.seasonal))
得到的分解和之前得到的看上去不同: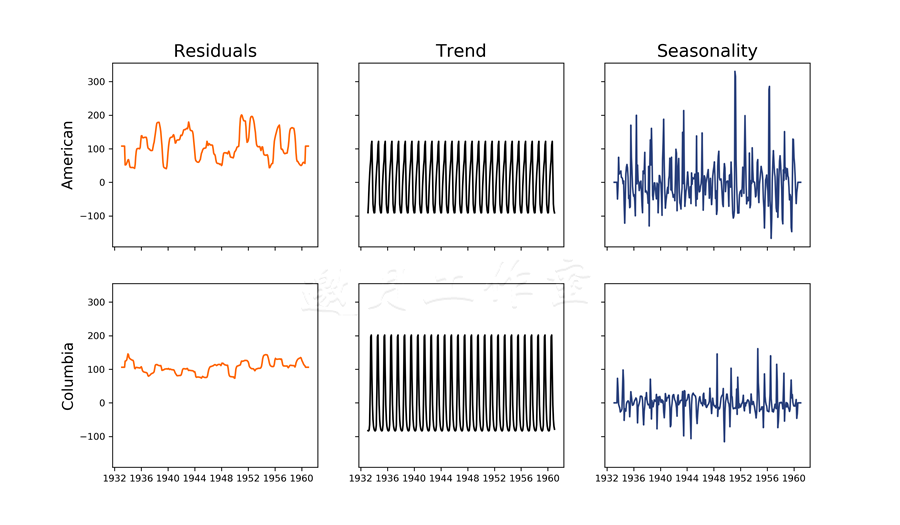
差异来自于移除趋势的方式不同:我们假设趋势在整个时域上是线性的,而.seasonal_decompose(...)方法使用卷积滤波以发现基础趋势。仔细观察的话,你会发现这个趋势图和过滤时间序列数据中的MA图的相似之处;区别在于.seasonal_decompose(...)方法使用的权重。
7.7使用ARMA和ARIMA模型预测未来
ARMA(autoregressive moving average,自回归移动*均)模型及其泛化——ARIMA(autoregressive integrated moving average,差分自回归移动*均)模型——是从时间序列预测未来时常用的两个模型。ARIMA的泛化是指这是一个整体:模型的第一步是在估算AR和MA之前做差分。
准备:需装好pandas、NumPy、Statsmodels和Matplotlib。你还需要前面技巧里准备的数据。
步骤:我们将处理过程包装在方法里,以便大部分建模可以自动化(ts_arima.py文件):
 1 def plot_functions(data, name):
 2     '''
 3         Method to plot the ACF and PACF functions
 4     '''
 5     # create the figure
 6     fig, ax = plt.subplots(2)
 7
 8     # plot the functions
 9     sm.graphics.tsa.plot_acf(data, lags=18, ax=ax[0])
10     sm.graphics.tsa.plot_pacf(data, lags=18, ax=ax[1])
11
12     # set titles for charts
13     ax[0].set_title(name.split('_')[-1])
14     ax[1].set_title('')
15
16     # set titles for rows
17     ax[0].set_ylabel('ACF')
18     ax[1].set_ylabel('PACF')
19
20     # save the figure
21     plt.savefig(data_folder+'/charts/'+name+'.png',
22         dpi=300)
23
24 def fit_model(data, params, modelType, f, t):
25     '''
26         Wrapper method to fit and plot the model
27     '''
28     # create the model object
29     model = sm.tsa.ARIMA(data, params)
30
31     # fit the model
32     model_res = model.fit(maxiter=600, trend='nc',
33         start_params=[.1] * (params[0]+params[2]), tol=1e-06)
34
35     # create figure
36     fig, ax = plt.subplots(1, figsize=(12, 8))
37
38     e = model.geterrors(model_res.params)
39     ax.plot(e, colors[3])
40
41     chartText = '{0}: ({1}, {2}, {3})'.format(
42         modelType.split('_')[0], params[0],
43         params[1], params[2])
44
45     # and put it on the chart
46     ax.text(0.1, 0.95, chartText, transform=ax.transAxes)
47
48     # and save the figure
49     plt.savefig(data_folder+'/charts/'+modelType+'_errors.png',
50         dpi=300)
51
52
53     # plot the model
54     plot_model(data['1950':], model_res, params,
55         modelType, f, t)
56
57     # and save the figure
58     plt.savefig(data_folder+'/charts/'+modelType+'.png',
59         dpi=300)
60
61 def plot_model(data, model, params, modelType, f, t):
62     '''
63         Method to plot the predictions of the model
64     '''
65     # create figure
66     fig, ax = plt.subplots(1, figsize=(12, 8))
67
68     # plot the data
69     data.plot(ax=ax, color=colors[0])
70
71     # plot the forecast
72     model.plot_predict(f, t, ax=ax, plot_insample=False)
73
74     # define chart text
75     chartText = '{0}: ({1}, {2}, {3})'.format(
76         modelType.split('_')[0], params[0],
77         params[1], params[2])
78
79     # and put it on the chart
80     ax.text(0.1, 0.95, chartText, transform=ax.transAxes)
原理:读入数据后,我们首先查看残差的ACF和PACF函数:
1 #plot the ACF and PACF functions
2 plot_functions(riverFlows['american_flow_r'],
3     'ACF_PACF_American')
4 plot_functions(riverFlows['columbia_flow_r'],
5     'ACF_PACF_Columbia')
分析图表有助于我们决定模型的AR和MA组件:
前一张图和下一张图分别代表美国河和哥伦比亚河的ACF和PACF函数: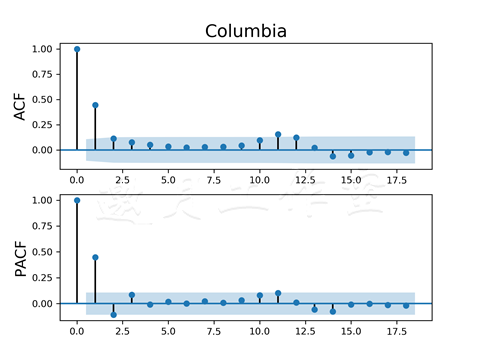
plot_functions(...)方法很像我们在7.3节中写的代码,所以这里我们不讨论它。
查看图表,我们可以看到自回归组件和移动*均组件,继而可以在模型构建阶段用其作为起始点:ACF函数有助于决定MA的顺序,而PACF函数允许我们决定AR部分。首要规则是查看显著落在置信区间之外的观测值。
从图表中可以推断:对于美国河模型我们以AR(2)和MA(4)开始,而对哥伦比亚河模型,我们从AR(3)和MA(2)开始:
 1 # fit american models
 2 fit_model(riverFlows['american_flow_r'], (2, 0, 4),
 3     'ARMA_American', '1960-11-30', '1962')
 4 fit_model(riverFlows['american_flow_r'], (2, 1, 4),
 5     'ARIMA_American', '1960-11-30', '1962')
 6
 7 # fit colum models
 8 fit_model(riverFlows['columbia_flow_r'], (3, 0, 2),
 9     'ARMA_Columbia', '1960-09-30', '1962')
10 fit_model(riverFlows['columbia_flow_r'], (3, 1, 2),
11     'ARIMA_Columbia', '1960-09-30', '1962')
fit_model(...)方法封装了模型构建需要的所有步骤。它以要估算模型的数据作为第一个参数。params参数用于定义模型的参数。modelType参数用于在我们调用plot_model(...)方法时装饰图表;f(从)参数和t(到)参数也传给了plot_model(...)方法。
首先,我们创建模型对象。我们选择.ARIMA(...)模型,因为它可以特化为ARMA模型。.ARIMA(...)方法以数据作为第一个参数,以参数元组作为第二个参数。元组的第一个元素描述了模型的AR部分,第二个元素描述了(ARIMA模型中)用于差分的滞后,最后一个元素描述了MA组件。
将差分部分设为0,ARIMA模型就成了ARMA模型。
然后,我们调整模型。我们将循环的最大次数设为300,趋势不带常量。我们也定义start_params;以一个六元素的列表,所有AR与MR组件的和开始。列表中每个元素都设成了起始点0.1。容忍度设为0.000001;如果循环间误差的差别小于容忍度,就停止估算。
估算出模型后,我们看一下它是如何完成的。plot_model(...)方法绘制观测的数据。从图表的简明考虑,我们调用方法时限制数据从1950开始。.plot_predict(...)方法使用估算的模型参数预测未来的观测值。头两个参数指定预测的上下界限:我们可以选择起始点与结束点。我们将plot_insample设为False;这个参数的文档极为缺乏,我们就经验主义一把,认为这个参数避免了方法用不同的颜色画与预测交叠的观测值。
不要预测太远的未来,因为预测的置信区间没理由就会变宽。
我们在图表的左上角加上文字;用.text(...)方法做到这一点。头两个参数是图表上的坐标:用.transformAxes转换轴坐标,我们知道坐标(0,0)是左下角,(1,1)是右上角。第三个参数是希望加的文字。
估算出了模型,看下图表: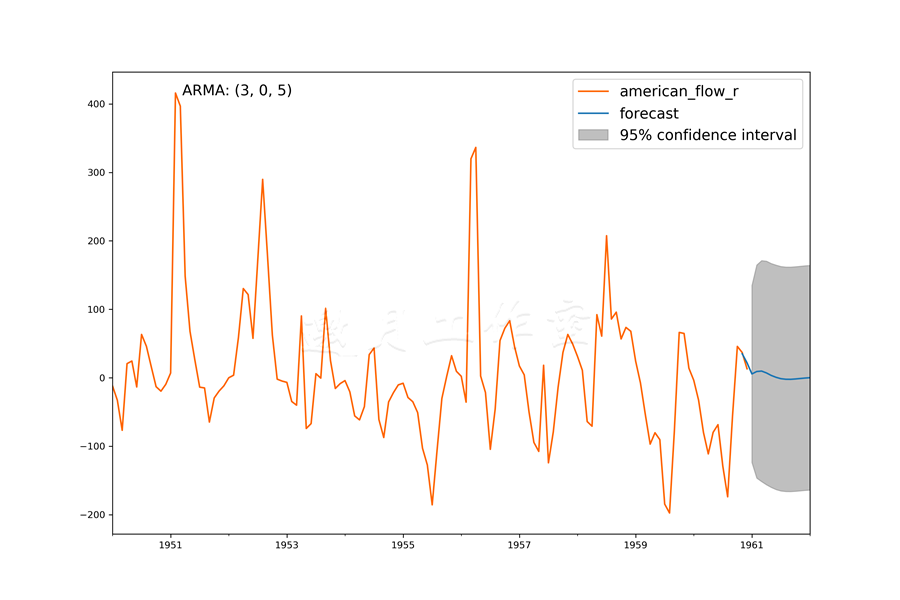
预测的美国河流量一开始遵循一个短期趋势,但是接下来(由于我们要从最后一个观测值往前走更远),置信区间激增,预测值就成了一个常数: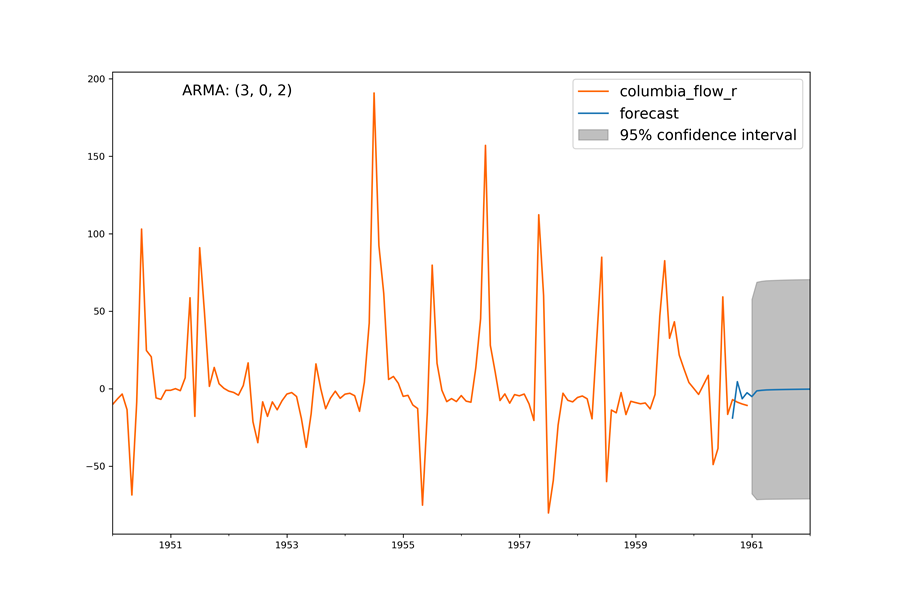
对于哥伦比亚河,一开始预测的流量看上去偏离了观测值,但是很快就*坦了: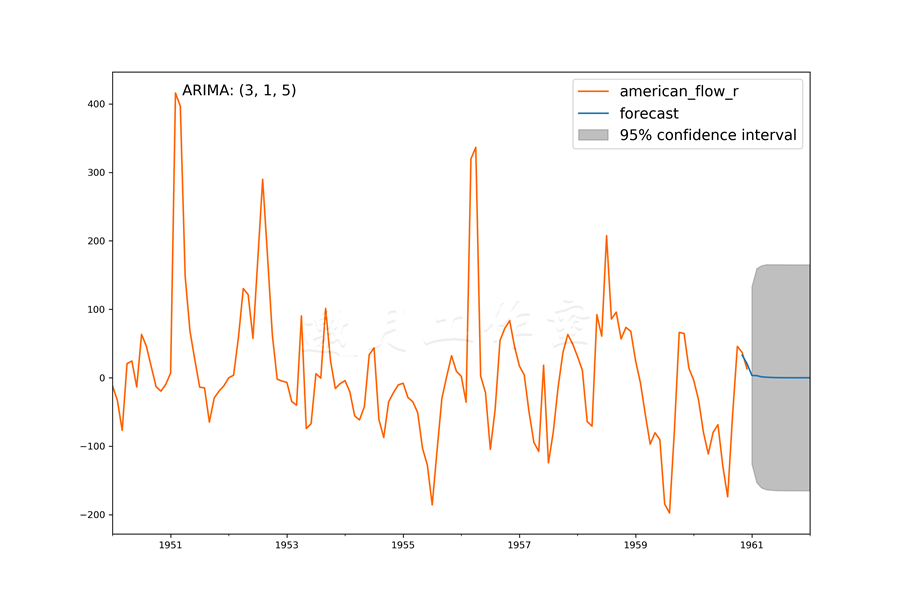
ARIMA模型的预测和ARMA模型的相差不大;预测一开始遵循观测数据,后来*坦了: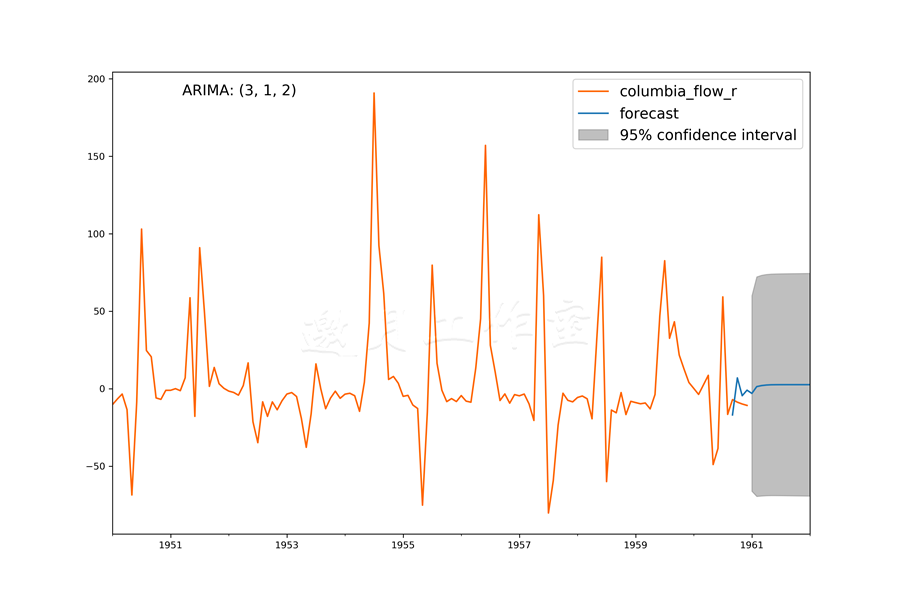
模型本质上是预测了残差的均值。
查看John Wittenauer对标普500指数的预测,可明白预测时间序列不是一件小事(http://www.johnwittenauer.net/a-simple-time-series-analysis-of-the-sp-500-index/)。
ACF和PACF函数得到的AR和MA参数应该只用作起始点。如果模型表现很好,就保留。否则,你可以微调。
我们也应该查看模型误差项的分布:
美国河的ARMA模型的误差项看上去很随机,这是预测时间序列时我们要追求的: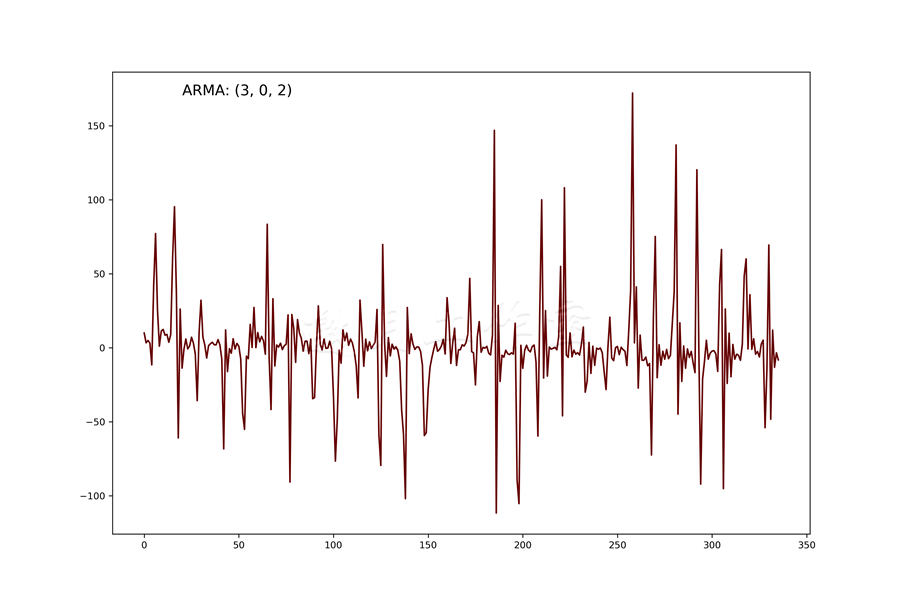
对于哥伦比亚河,误差项能看到一些重复的模式,这给模型预测未来流量的能力打上了一个问号: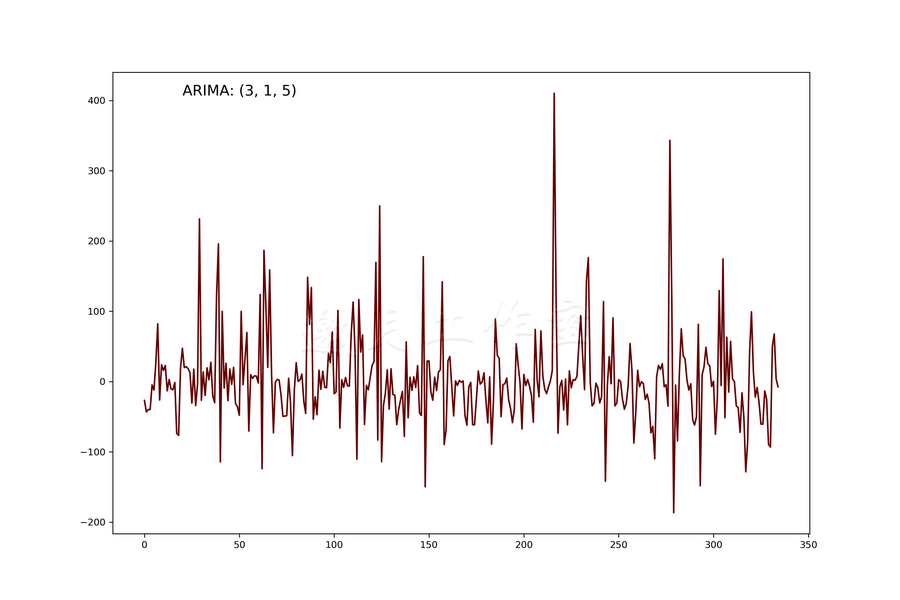
美国河的ARIMA模型也生成了类似随机残差的结果: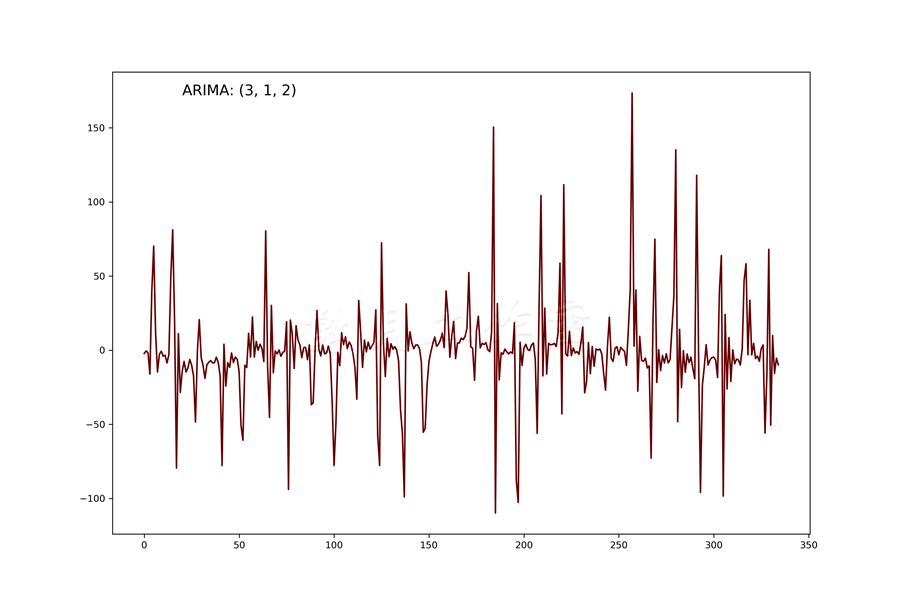
最终,误差项看上去应该像是白噪音。对于哥伦比亚河模型,这不一定对,因为我们也看到出现了模式。你可以试试不同的AR和MA参数,看模型是否有不同的结果。
参考
McKinney、Perktold和Seabold对时间序列做出了一个很好的展示/教程。值得一看:http://conference.scipy.org/scipy2011/slides/mckinney_time_series.pdf。
第7章完。


 托马兹·卓巴斯的《数据分析实战》,2018年6月出版,本系列为读书笔记。主要是为了系统整理,加深记忆。 第7章探索了如何处理和理解时间序列数据,并建立ARMA模型以及ARIMA模型。


【推荐】国内首个AI IDE,深度理解中文开发场景,立即下载体验Trae
【推荐】编程新体验,更懂你的AI,立即体验豆包MarsCode编程助手
【推荐】抖音旗下AI助手豆包,你的智能百科全书,全免费不限次数
【推荐】轻量又高性能的 SSH 工具 IShell:AI 加持,快人一步
· 从 HTTP 原因短语缺失研究 HTTP/2 和 HTTP/3 的设计差异
· AI与.NET技术实操系列:向量存储与相似性搜索在 .NET 中的实现
· 基于Microsoft.Extensions.AI核心库实现RAG应用
· Linux系列:如何用heaptrack跟踪.NET程序的非托管内存泄露
· 开发者必知的日志记录最佳实践
· winform 绘制太阳,地球,月球 运作规律
· AI与.NET技术实操系列(五):向量存储与相似性搜索在 .NET 中的实现
· 超详细:普通电脑也行Windows部署deepseek R1训练数据并当服务器共享给他人
· 【硬核科普】Trae如何「偷看」你的代码?零基础破解AI编程运行原理
· 上周热点回顾(3.3-3.9)
2011-03-28 Asp.net页面中给DropDownList赋值