Python进行数据分析—可视化之seaborn
安装seaborn,可以使用 pip:
pip install seaborn
也可以使用 conda:
conda install seaborn
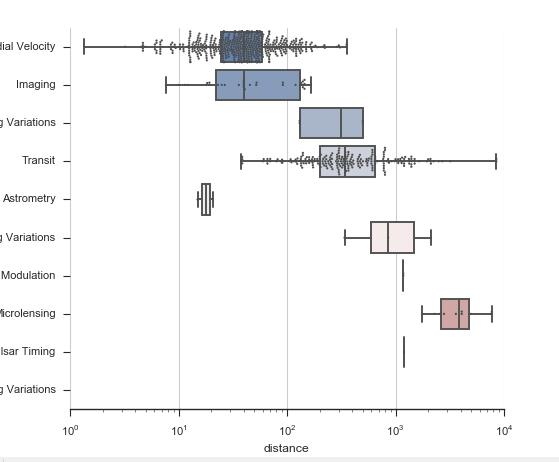
一个简单的箱线图:
import numpy as np
import seaborn as sns
import matplotlib.pyplot as plt

sns.set(style="ticks")

# Initialize the figure with a logarithmic x axis
f, ax = plt.subplots(figsize=(7, 6))
ax.set_xscale("log")

# Load the example planets dataset
planets = sns.load_dataset("planets")

# Plot the orbital period with horizontal boxes
sns.boxplot(x="distance", y="method", data=planets,
            whis=np.inf, palette="vlag")

# Add in points to show each observation
sns.swarmplot(x="distance", y="method", data=planets,
              size=2, color=".3", linewidth=0)

# Tweak the visual presentation
ax.xaxis.grid(True)
ax.set(ylabel="")
sns.despine(trim=True, left=True)

plt.show()  # 记得show()一下

 浙公网安备 33010602011771号