Prometheus node_exporter grafana 持续更新中
什么是Prometheus
Prometheus是一个最初在SoundCloud上构建的开源系统监视和警报工具包 。自2012年成立以来,许多公司和组织都采用了Prometheus,该项目拥有一个非常活跃的开发人员和用户社区。它现在是一个独立的开源项目,可以独立于任何公司进行维护。为了强调这一点,并澄清项目的治理结构,Prometheus 于2016年加入 云计算本地计算基金会,作为继Kubernetes之后的第二个托管项目。
特点
- 具有由度量名称和键/值对标识的时间序列数据的多维数据模型
- PromQL,一种灵活的查询语言, 可以利用这一维度
- 不依赖分布式存储; 单个服务器节点是自治的
- 时间序列集合通过HTTP上的拉模型发生
- 推送时间序列通过中间网关支持
- 通过服务发现或静态配置发现目标
- 多种图形和仪表板支持模式
架构图和效果图
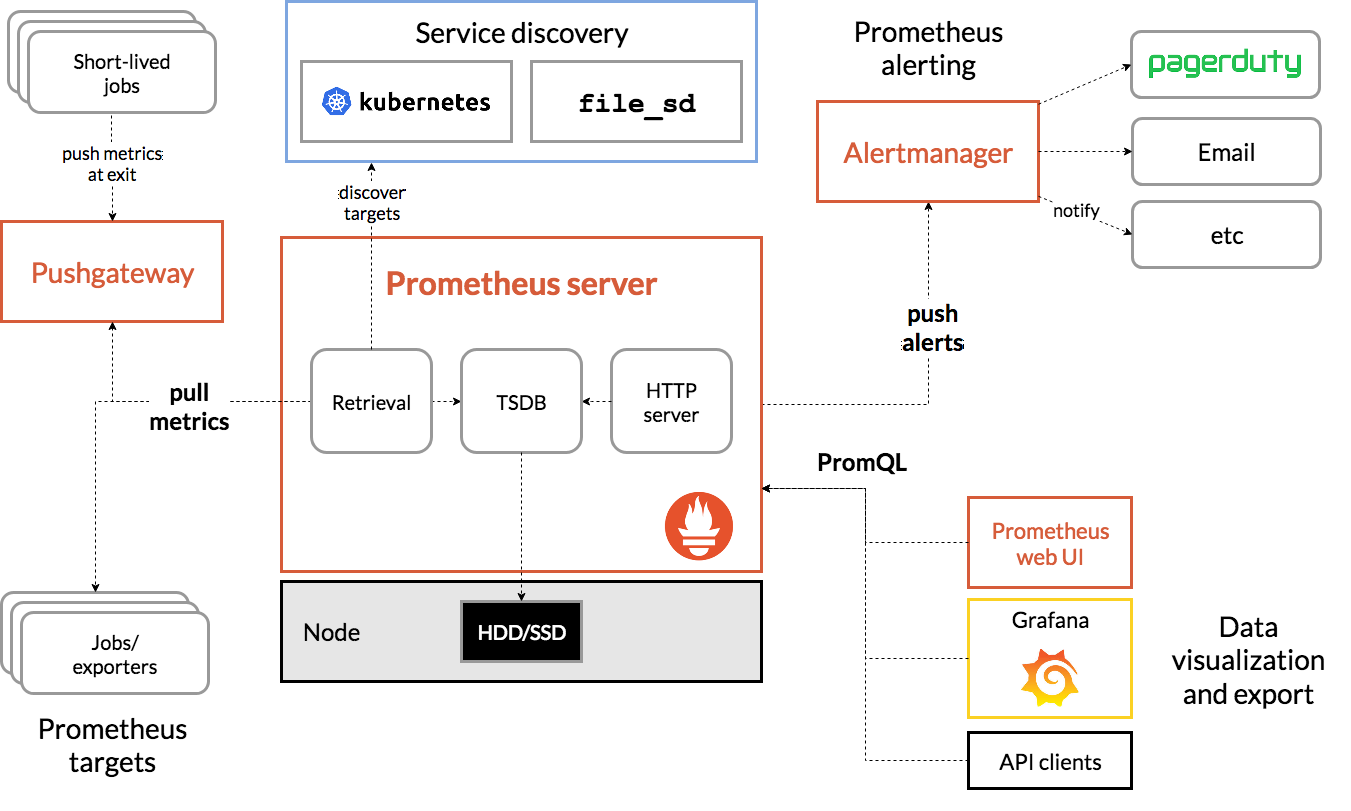
官方网站
安装配置
实验环境描述:
笔记本内存不足,只有一台虚拟机😂,目前所用的组件(node_exporter,prometheus,grafana)均安装至此
- 安装Prometheus
|
官方网站 |
https://prometheus.io/ |
|
下载地址 |
|
|
系统环境 |
Centos 7_1810x64 |
- 运行方式
1,点杠直接运行(不推荐)
2,screen
3,daemonize
4,编写成系统服务 (本文使用的)
5,nohub &
- 编写系统服务
在/usr/lib/systemd/system目录下新建prometheus.service文件。文件内的路径根据实际修改
1 [root@node1 ~]# cat /usr/lib/systemd/system/prometheus.service
2 [Unit]
3 Description=https://prometheus.io/
4 [Service]
5 Type=simple
6 ExecStartPre=/mnt/prometheus/promtool check config /mnt/prometheus/prometheus.yml
7 ExecStart=/mnt/prometheus/prometheus  --config.file=/mnt/prometheus/prometheus.yml --storage.tsdb.path=/mnt/prometheus/data  --web.enable-lifecycle
8 [Install]
9 WantedBy=multi-user.target
常用参数解释
--version    不解释
--config.file    指定配置文件路径,绝对路径
--web.listen-address    监听地址端口    默认,9090忽略
--web.read-timeout=5m    请求连接的最大等待时间, 防止太多的空闲链接,占用资源
--storage.tsdb.retention      采集监控数据后会存在内存中和硬盘中, 太长的话,硬盘和内存都吃不消,设置15天为宜
--web.max-connections     最大链接数
--storage.tsdb.path    数据存储路径
--query.timeout=2m    查询超时
--query.max-concurrency=200    最多同时查询人数
--web.enable-lifecycle    允许通过http请求关闭服务和重新加载
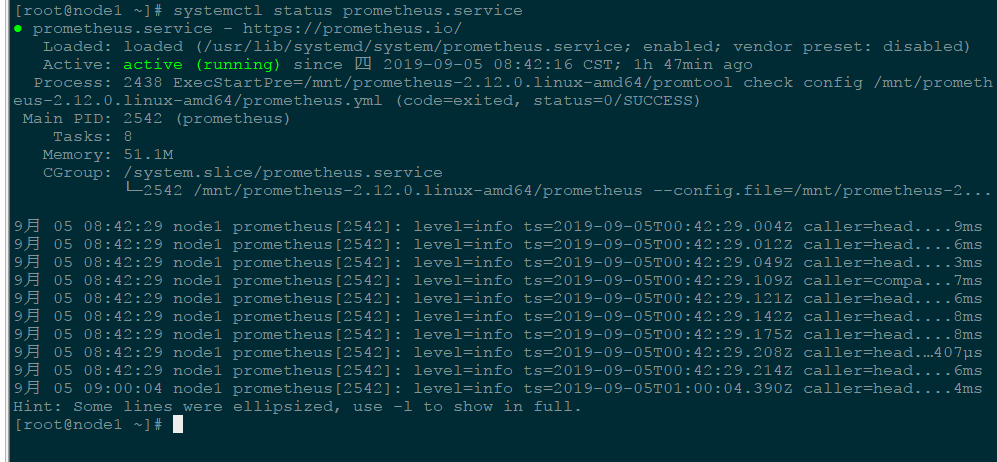
相关命令
1 systemctl daemon-reload          #重新加载配置文件
2 systemctl start prometheus       #开启服务
3 systemctl enable prometheus    #开机自启
截图如下,
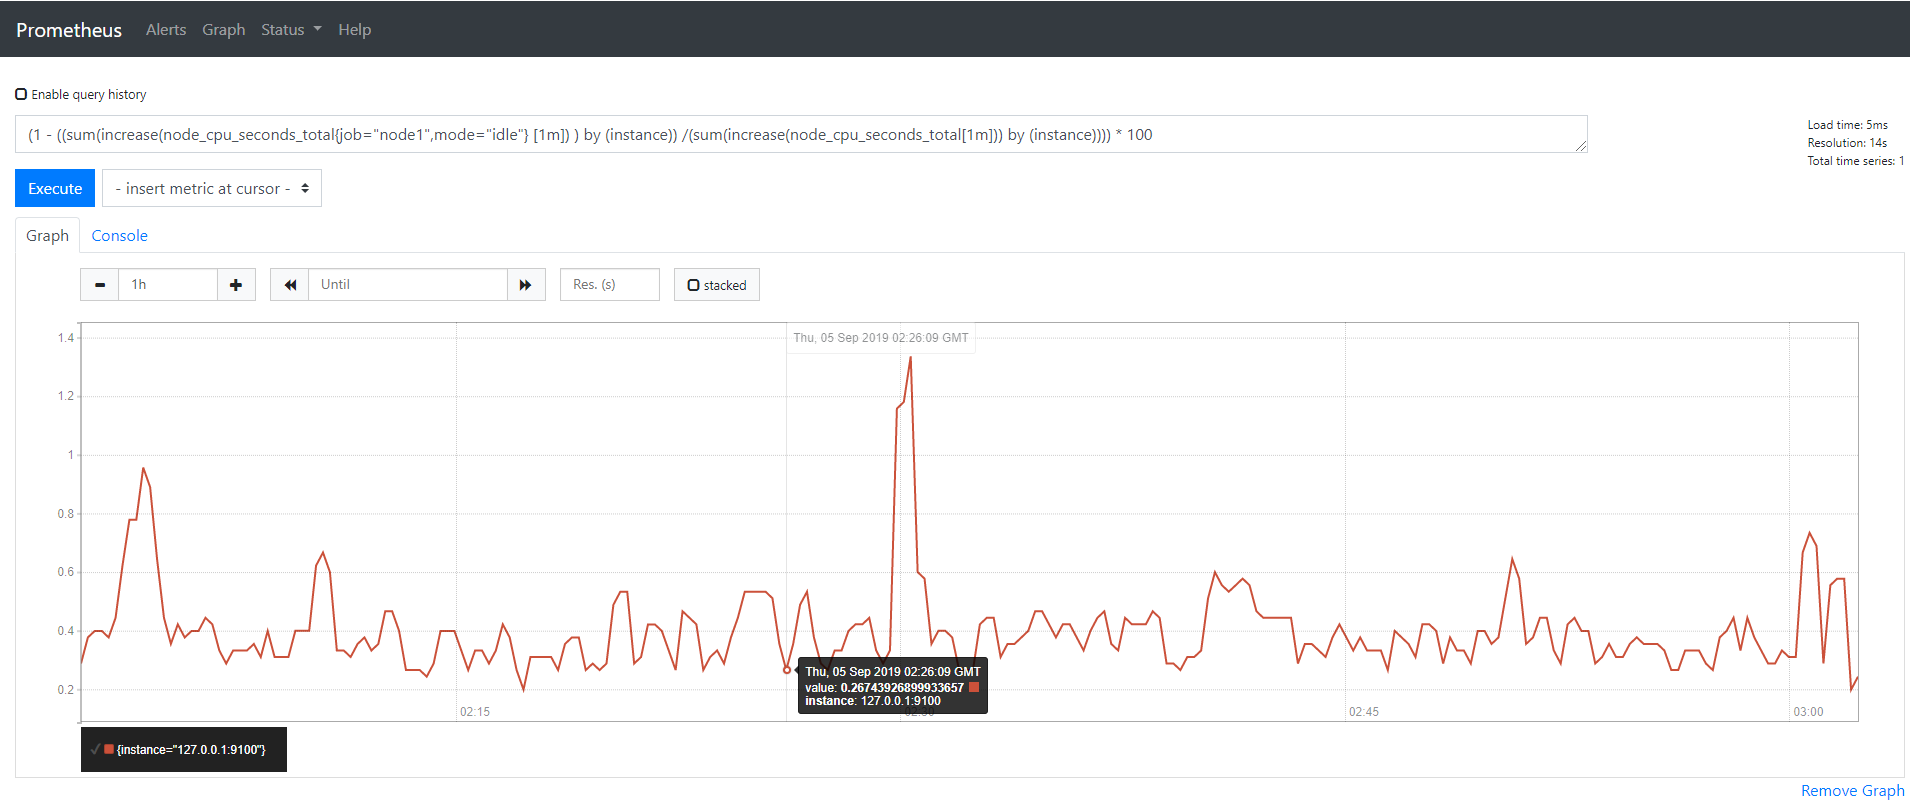
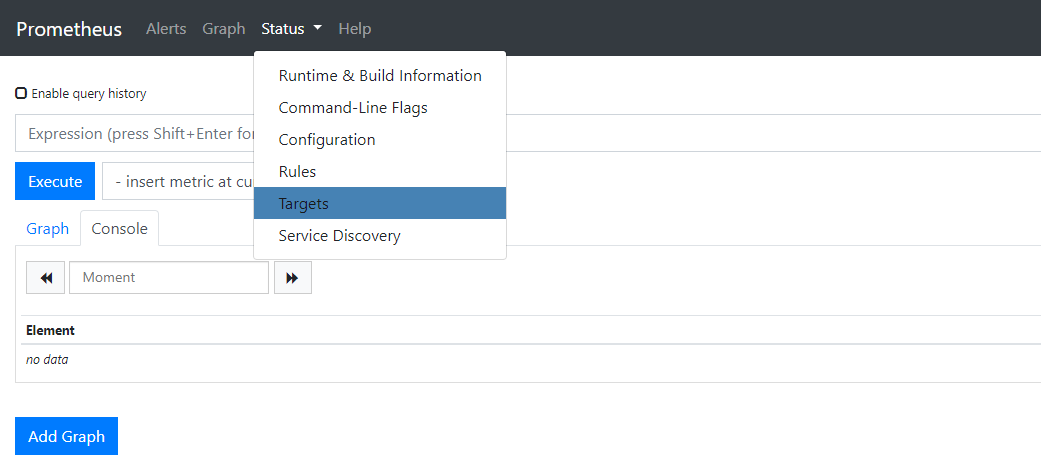
访问webui,默认端口9090 #地址 http://IP:9090
可在此编辑使用PromQL语句进行调试。下图所示查询cpu使用率。Prometheus还提供了一个简单视图。后期使用grafana用作图形展示,现在新版本还支持报警功能

安装node_exporter
白话介绍,linux服务器信息收集工具,可满足日常需求。被动式,等待服务器抓取
官网https://prometheus.io/download/#node_exporter
里面有各种exporter提供使用(windows,数据库,各种组件的监控)可满足日常所需,在centos6和7测试无问题。安装方式参考上面Prometheus。默认端口9100
如需自己编写exporter监控程序抓取数据,可通过pushgateway来实现。官网有介绍
安装完成之后,修改Prometheus配置文件(频率,目标等),最后三行为新增。静态文本配置方式(不推荐),动态配置学习中,后续更新
# my global config
global:
  scrape_interval:     15s # Set the scrape interval to every 15 seconds. Default is every 1 minute.
  evaluation_interval: 15s # Evaluate rules every 15 seconds. The default is every 1 minute.
  # scrape_timeout is set to the global default (10s).

# Alertmanager configuration
alerting:
  alertmanagers:
  - static_configs:
    - targets:
      # - alertmanager:9093

# Load rules once and periodically evaluate them according to the global 'evaluation_interval'.
rule_files:
  # - "first_rules.yml"
  # - "second_rules.yml"

# A scrape configuration containing exactly one endpoint to scrape:
# Here it's Prometheus itself.
scrape_configs:
  # The job name is added as a label `job=<job_name>` to any timeseries scraped from this config.
  - job_name: 'prometheus'

    # metrics_path defaults to '/metrics'
    # scheme defaults to 'http'.

    static_configs:
    - targets: ['localhost:9090']
  - job_name: 'node1'
    static_configs:
    - targets: ['127.0.0.1:9100']
之后重启Prometheus
方式1
#systemctl daemon-reload
#systemctl restart prometheus
方式2
curl -X POST http://127.0.0.1:9090/-/reload
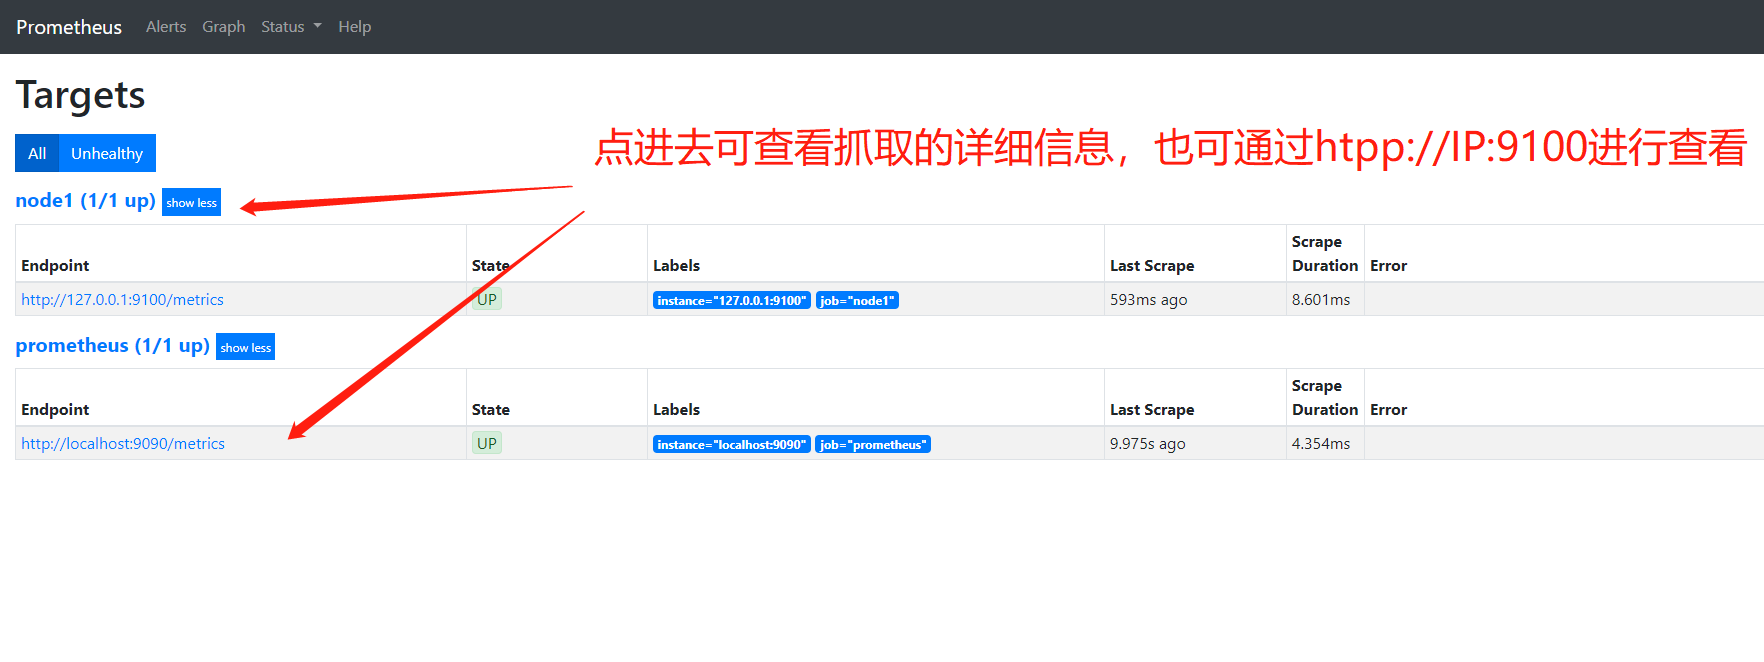
通过Prometheus可查看状态及详细信息
http://IP:9090
安装grafana
Grafana是一个跨平台的开源的度量分析和可视化工具,可以通过将采集的数据查询然后可视化的展示,并及时通知
官网下载地址 https://grafana.com/grafana/download
安装方式
系统 Ubuntu & Debian
wget https://dl.grafana.com/oss/release/grafana_6.3.3_amd64.deb
dpkg -i grafana_6.3.3_amd64.deb
系统  Standalone Linux Binaries
wget https://dl.grafana.com/oss/release/grafana-6.3.3.linux-amd64.tar.gz
系统   Redhat & Centos
wget https://dl.grafana.com/oss/release/grafana-6.3.3-1.x86_64.rpm
yum localinstall grafana-6.3.3-1.x86_64.rpm
centos 常用命令
systemctl daemon-reload
systemctl enable grafana-server.service
systemctl start grafana-server.service
配置
rpm安装方式配置文件在 /etc/grafana/grafana.ini 配置先忽略了
官网https://grafana.com/docs/installation/configuration/
访问界面
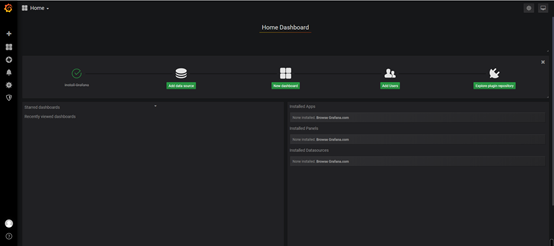
访问地址http://IP:3000 (默认端口3000)
首次登录后修改密码(默认账户,密码 admin)。然后首页如下
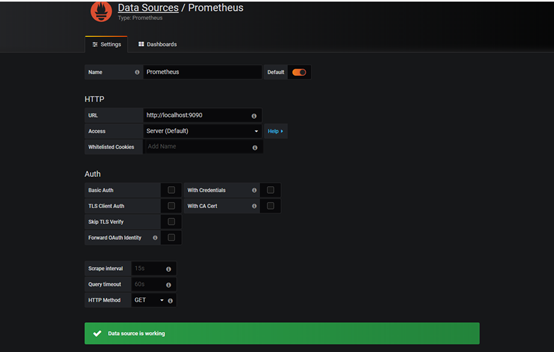
点增加数据源,选择Prometheus
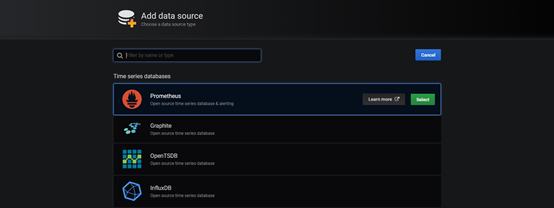
输入相应信息测试并保存
点dashboards导入系统自带面板,后续增加用户和插件。。。。。略
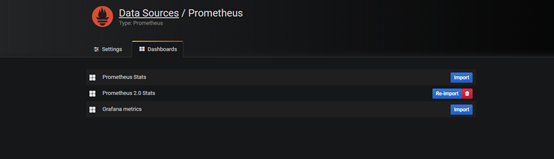
查看刚导入的模板
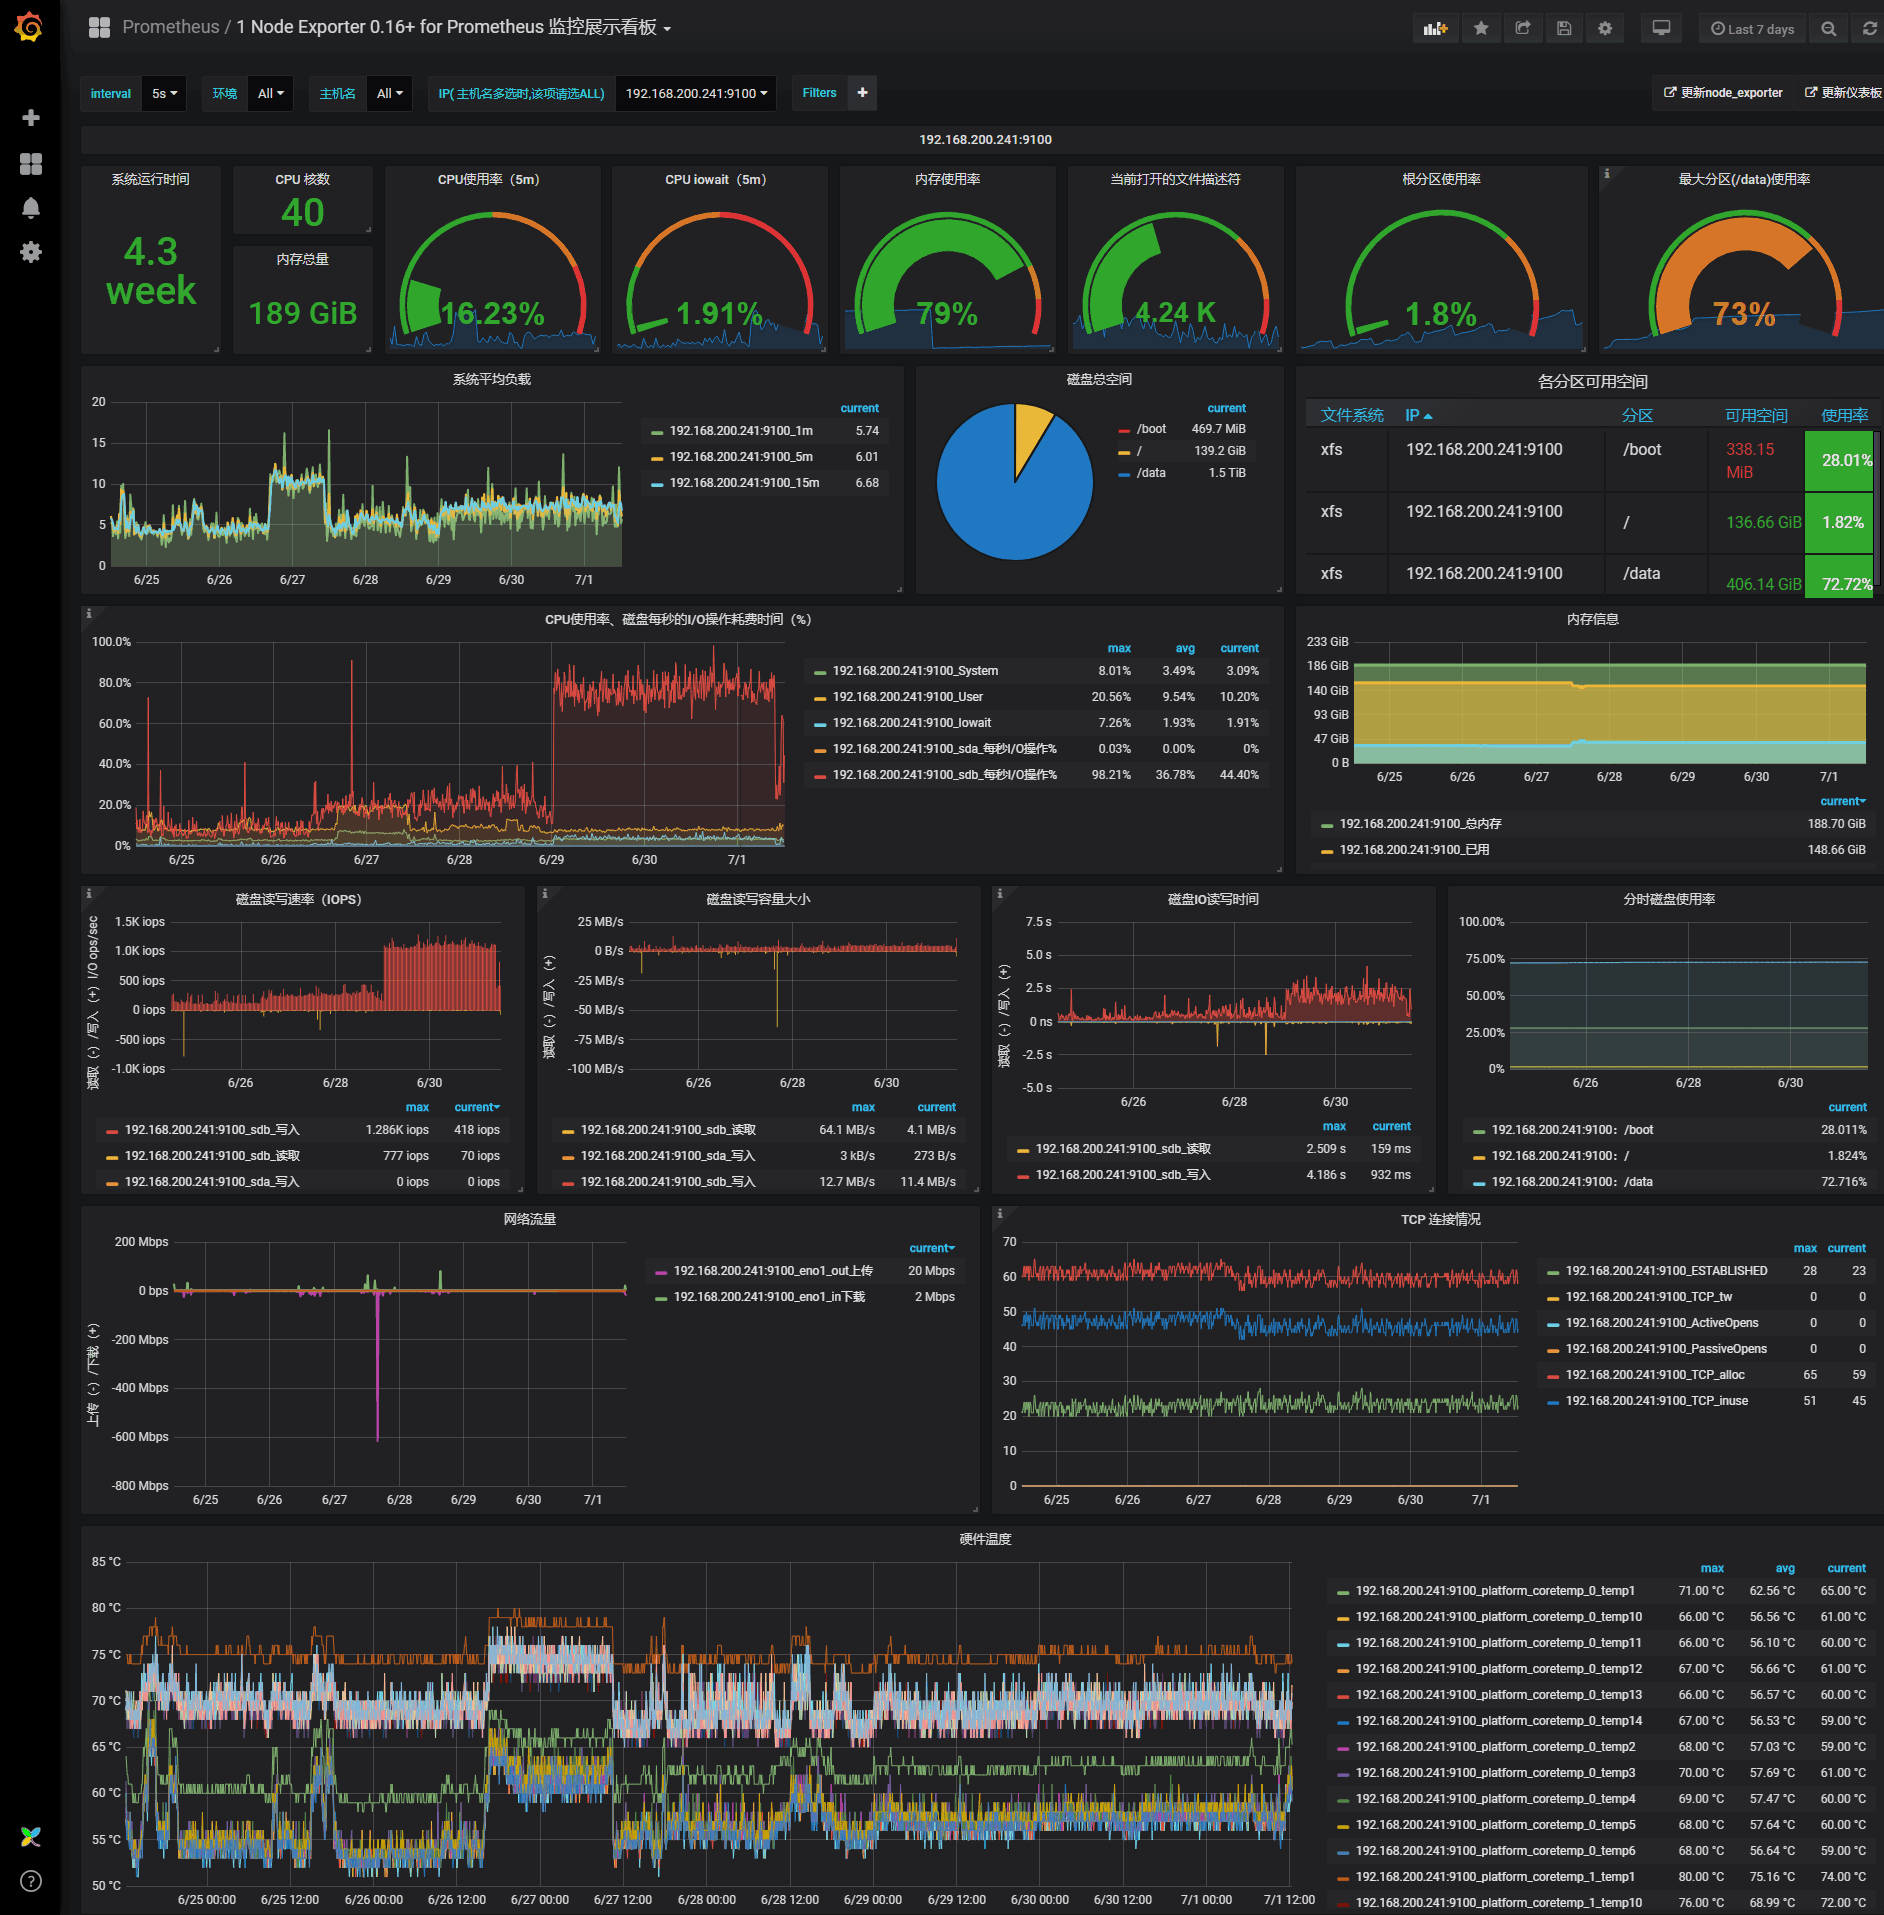
点击home选择刚导入的dashboards,显示如下,可自定义面板,及监控数据。图形也可通过插件扩展。
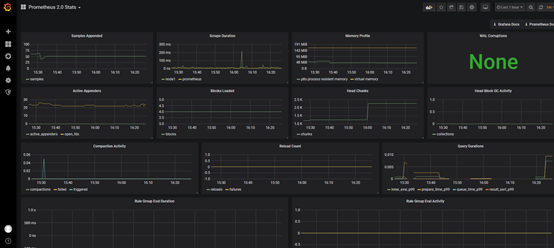
上图有点丑对吧,哈哈。没事的,有大神做好了,very beautiful的图。只需导入就行了,下面贴配置。共2500行我折叠了
源码及说明:https://github.com/starsliao/Prometheus


{ "__inputs": [ { "name": "DS_PROMETHEUS_111", "label": "prometheus", "description": "", "type": "datasource", "pluginId": "prometheus", "pluginName": "Prometheus" } ], "__requires": [ { "type": "grafana", "id": "grafana", "name": "Grafana", "version": "5.4.2" }, { "type": "panel", "id": "grafana-piechart-panel", "name": "Pie Chart", "version": "1.3.3" }, { "type": "panel", "id": "graph", "name": "Graph", "version": "5.0.0" }, { "type": "datasource", "id": "prometheus", "name": "Prometheus", "version": "5.0.0" }, { "type": "panel", "id": "singlestat", "name": "Singlestat", "version": "5.0.0" }, { "type": "panel", "id": "table", "name": "Table", "version": "5.0.0" }, { "type": "panel", "id": "text", "name": "Text", "version": "5.0.0" } ], "annotations": { "list": [ { "builtIn": 1, "datasource": "-- Grafana --", "enable": true, "hide": true, "iconColor": "rgba(0, 211, 255, 1)", "name": "Annotations & Alerts", "type": "dashboard" } ] }, "description": "使用 Node Exporter v0.16+,精简优化重要指标展示。包含:CPU 内存 磁盘 IO 网络 温度等监控指标。https://github.com/starsliao/Prometheus", "editable": true, "gnetId": 8919, "graphTooltip": 0, "id": null, "iteration": 1561954753319, "links": [ { "icon": "external link", "tags": [], "targetBlank": true, "title": "更新node_exporter", "tooltip": "", "type": "link", "url": "https://github.com/prometheus/node_exporter/releases" }, { "icon": "external link", "tags": [], "targetBlank": true, "title": "更新仪表板", "tooltip": "", "type": "link", "url": "https://grafana.com/dashboards/8919" } ], "panels": [ { "content": "", "editable": true, "error": false, "gridPos": { "h": 1, "w": 24, "x": 0, "y": 0 }, "id": 11, "links": [], "minSpan": 4, "mode": "html", "repeat": "node", "repeatDirection": "h", "style": {}, "title": "$node", "type": "text" }, { "cacheTimeout": null, "colorBackground": false, "colorPostfix": false, "colorPrefix": false, "colorValue": true, "colors": [ "rgba(245, 54, 54, 0.9)", "rgba(237, 129, 40, 0.89)", "rgba(50, 172, 45, 0.97)" ], "datasource": "${DS_PROMETHEUS_111}", "decimals": 1, "description": "", "format": "s", "gauge": { "maxValue": 100, "minValue": 0, "show": false, "thresholdLabels": false, "thresholdMarkers": true }, "gridPos": { "h": 5, "w": 2, "x": 0, "y": 1 }, "hideTimeOverride": true, "id": 15, "interval": null, "links": [], "mappingType": 1, "mappingTypes": [ { "name": "value to text", "value": 1 }, { "name": "range to text", "value": 2 } ], "maxDataPoints": 100, "nullPointMode": "null", "nullText": null, "postfix": "", "postfixFontSize": "50%", "prefix": "", "prefixFontSize": "50%", "rangeMaps": [ { "from": "null", "text": "N/A", "to": "null" } ], "sparkline": { "fillColor": "rgba(31, 118, 189, 0.18)", "full": false, "lineColor": "rgb(31, 120, 193)", "show": false }, "tableColumn": "", "targets": [ { "expr": "time() - node_boot_time_seconds{instance=~\"$node\"}", "format": "time_series", "hide": false, "instant": true, "intervalFactor": 2, "refId": "A", "step": 40 } ], "thresholds": "1,2", "title": "系统运行时间", "transparent": false, "type": "singlestat", "valueFontSize": "100%", "valueMaps": [ { "op": "=", "text": "N/A", "value": "null" } ], "valueName": "current" }, { "cacheTimeout": null, "colorBackground": false, "colorPostfix": false, "colorValue": true, "colors": [ "rgba(245, 54, 54, 0.9)", "rgba(237, 129, 40, 0.89)", "rgba(50, 172, 45, 0.97)" ], "datasource": "${DS_PROMETHEUS_111}", "description": "", "format": "short", "gauge": { "maxValue": 100, "minValue": 0, "show": false, "thresholdLabels": false, "thresholdMarkers": true }, "gridPos": { "h": 2, "w": 2, "x": 2, "y": 1 }, "id": 14, "interval": null, "links": [], "mappingType": 1, "mappingTypes": [ { "name": "value to text", "value": 1 }, { "name": "range to text", "value": 2 } ], "maxDataPoints": 100, "minSpan": 4, "nullPointMode": "null", "nullText": null, "postfix": "", "postfixFontSize": "50%", "prefix": "", "prefixFontSize": "50%", "rangeMaps": [ { "from": "null", "text": "N/A", "to": "null" } ], "sparkline": { "fillColor": "rgba(31, 118, 189, 0.18)", "full": false, "lineColor": "rgb(31, 120, 193)", "show": false }, "tableColumn": "", "targets": [ { "expr": "count(count(node_cpu_seconds_total{instance=~\"$node\", mode='system'}) by (cpu))", "format": "time_series", "instant": true, "intervalFactor": 1, "legendFormat": "", "refId": "A", "step": 20 } ], "thresholds": "1,2", "title": "CPU 核数", "type": "singlestat", "valueFontSize": "100%", "valueMaps": [ { "op": "=", "text": "N/A", "value": "null" } ], "valueName": "current" }, { "cacheTimeout": null, "colorBackground": false, "colorValue": true, "colors": [ "rgba(50, 172, 45, 0.97)", "rgba(237, 129, 40, 0.89)", "rgba(245, 54, 54, 0.9)" ], "datasource": "${DS_PROMETHEUS_111}", "decimals": 2, "description": "", "format": "percent", "gauge": { "maxValue": 100, "minValue": 0, "show": true, "thresholdLabels": false, "thresholdMarkers": true }, "gridPos": { "h": 5, "w": 3, "x": 4, "y": 1 }, "id": 167, "interval": null, "links": [], "mappingType": 1, "mappingTypes": [ { "name": "value to text", "value": 1 }, { "name": "range to text", "value": 2 } ], "maxDataPoints": 100, "minSpan": 2, "nullPointMode": "null", "nullText": null, "postfix": "", "postfixFontSize": "50%", "prefix": "", "prefixFontSize": "50%", "rangeMaps": [ { "from": "null", "text": "N/A", "to": "null" } ], "sparkline": { "fillColor": "rgba(31, 118, 189, 0.18)", "full": false, "lineColor": "rgb(31, 120, 193)", "show": true }, "tableColumn": "", "targets": [ { "expr": "100 - (avg(irate(node_cpu_seconds_total{instance=~\"$node\",mode=\"idle\"}[5m])) * 100)", "format": "time_series", "hide": false, "interval": "", "intervalFactor": 1, "legendFormat": "", "refId": "A", "step": 20 } ], "thresholds": "50,80", "title": "CPU使用率(5m)", "type": "singlestat", "valueFontSize": "80%", "valueMaps": [ { "op": "=", "text": "N/A", "value": "null" } ], "valueName": "current" }, { "cacheTimeout": null, "colorBackground": false, "colorValue": true, "colors": [ "rgba(50, 172, 45, 0.97)", "rgba(237, 129, 40, 0.89)", "rgba(245, 54, 54, 0.9)" ], "datasource": "${DS_PROMETHEUS_111}", "decimals": 2, "description": "", "format": "percent", "gauge": { "maxValue": 100, "minValue": 0, "show": true, "thresholdLabels": false, "thresholdMarkers": true }, "gridPos": { "h": 5, "w": 3, "x": 7, "y": 1 }, "id": 20, "interval": null, "links": [], "mappingType": 1, "mappingTypes": [ { "name": "value to text", "value": 1 }, { "name": "range to text", "value": 2 } ], "maxDataPoints": 100, "minSpan": 2, "nullPointMode": "null", "nullText": null, "postfix": "", "postfixFontSize": "50%", "prefix": "", "prefixFontSize": "50%", "rangeMaps": [ { "from": "null", "text": "N/A", "to": "null" } ], "sparkline": { "fillColor": "rgba(31, 118, 189, 0.18)", "full": false, "lineColor": "rgb(31, 120, 193)", "show": true }, "tableColumn": "", "targets": [ { "expr": "avg(irate(node_cpu_seconds_total{instance=~\"$node\",mode=\"iowait\"}[5m])) * 100", "format": "time_series", "hide": false, "interval": "", "intervalFactor": 1, "legendFormat": "", "refId": "A", "step": 20 } ], "thresholds": "20,50", "title": "CPU iowait(5m)", "type": "singlestat", "valueFontSize": "80%", "valueMaps": [ { "op": "=", "text": "N/A", "value": "null" } ], "valueName": "current" }, { "cacheTimeout": null, "colorBackground": false, "colorValue": true, "colors": [ "rgba(50, 172, 45, 0.97)", "rgba(237, 129, 40, 0.89)", "rgba(245, 54, 54, 0.9)" ], "datasource": "${DS_PROMETHEUS_111}", "decimals": 0, "description": "", "format": "percent", "gauge": { "maxValue": 100, "minValue": 0, "show": true, "thresholdLabels": false, "thresholdMarkers": true }, "gridPos": { "h": 5, "w": 3, "x": 10, "y": 1 }, "hideTimeOverride": false, "id": 172, "interval": null, "links": [], "mappingType": 1, "mappingTypes": [ { "name": "value to text", "value": 1 }, { "name": "range to text", "value": 2 } ], "maxDataPoints": 100, "minSpan": 4, "nullPointMode": "null", "nullText": null, "postfix": "", "postfixFontSize": "50%", "prefix": "", "prefixFontSize": "50%", "rangeMaps": [ { "from": "null", "text": "N/A", "to": "null" } ], "sparkline": { "fillColor": "rgba(31, 118, 189, 0.18)", "full": false, "lineColor": "rgb(31, 120, 193)", "show": true }, "tableColumn": "", "targets": [ { "expr": "(1 - (node_memory_MemAvailable_bytes{instance=~\"$node\"} / (node_memory_MemTotal_bytes{instance=~\"$node\"})))* 100", "format": "time_series", "hide": false, "interval": "10s", "intervalFactor": 1, "refId": "A", "step": 20 } ], "thresholds": "80,90", "title": "内存使用率", "type": "singlestat", "valueFontSize": "80%", "valueMaps": [], "valueName": "current" }, { "cacheTimeout": null, "colorBackground": false, "colorPostfix": false, "colorPrefix": false, "colorValue": true, "colors": [ "rgba(50, 172, 45, 0.97)", "rgba(237, 129, 40, 0.89)", "rgba(245, 54, 54, 0.9)" ], "datasource": "${DS_PROMETHEUS_111}", "decimals": 2, "description": "", "format": "short", "gauge": { "maxValue": 10000, "minValue": null, "show": true, "thresholdLabels": false, "thresholdMarkers": true }, "gridPos": { "h": 5, "w": 3, "x": 13, "y": 1 }, "hideTimeOverride": false, "id": 16, "interval": null, "links": [], "mappingType": 1, "mappingTypes": [ { "name": "value to text", "value": 1 }, { "name": "range to text", "value": 2 } ], "maxDataPoints": 100, "minSpan": 4, "nullPointMode": "null", "nullText": null, "postfix": "", "postfixFontSize": "50%", "prefix": "", "prefixFontSize": "50%", "rangeMaps": [ { "from": "null", "text": "N/A", "to": "null" } ], "sparkline": { "fillColor": "rgba(31, 118, 189, 0.18)", "full": false, "lineColor": "rgb(31, 120, 193)", "show": true }, "tableColumn": "", "targets": [ { "expr": "node_filefd_allocated{instance=~\"$node\"}", "format": "time_series", "instant": false, "interval": "10s", "intervalFactor": 1, "refId": "B" } ], "thresholds": "7000,9000", "title": "当前打开的文件描述符", "transparent": false, "type": "singlestat", "valueFontSize": "70%", "valueMaps": [], "valueName": "current" }, { "cacheTimeout": null, "colorBackground": false, "colorValue": true, "colors": [ "rgba(50, 172, 45, 0.97)", "rgba(237, 129, 40, 0.89)", "rgba(245, 54, 54, 0.9)" ], "datasource": "${DS_PROMETHEUS_111}", "decimals": null, "description": "", "format": "percent", "gauge": { "maxValue": 100, "minValue": 0, "show": true, "thresholdLabels": false, "thresholdMarkers": true }, "gridPos": { "h": 5, "w": 4, "x": 16, "y": 1 }, "id": 166, "interval": null, "links": [], "mappingType": 1, "mappingTypes": [ { "name": "value to text", "value": 1 }, { "name": "range to text", "value": 2 } ], "maxDataPoints": 100, "minSpan": 4, "nullPointMode": "null", "nullText": null, "postfix": "", "postfixFontSize": "50%", "prefix": "", "prefixFontSize": "50%", "rangeMaps": [ { "from": "null", "text": "N/A", "to": "null" } ], "repeatDirection": "h", "sparkline": { "fillColor": "rgba(31, 118, 189, 0.18)", "full": false, "lineColor": "rgb(31, 120, 193)", "show": true }, "tableColumn": "", "targets": [ { "expr": "100 - ((node_filesystem_avail_bytes{instance=~\"$node\",mountpoint=\"/\",fstype=~\"ext4|xfs\"} * 100) / node_filesystem_size_bytes {instance=~\"$node\",mountpoint=\"/\",fstype=~\"ext4|xfs\"})", "format": "time_series", "interval": "10s", "intervalFactor": 1, "refId": "A", "step": 20 } ], "thresholds": "70,90", "title": "根分区使用率", "type": "singlestat", "valueFontSize": "80%", "valueMaps": [ { "op": "=", "text": "N/A", "value": "null" } ], "valueName": "current" }, { "cacheTimeout": null, "colorBackground": false, "colorValue": true, "colors": [ "rgba(50, 172, 45, 0.97)", "rgba(237, 129, 40, 0.89)", "rgba(245, 54, 54, 0.9)" ], "datasource": "${DS_PROMETHEUS_111}", "decimals": null, "description": "通过变量maxmount获取最大的分区。", "format": "percent", "gauge": { "maxValue": 100, "minValue": 0, "show": true, "thresholdLabels": false, "thresholdMarkers": true }, "gridPos": { "h": 5, "w": 4, "x": 20, "y": 1 }, "id": 154, "interval": null, "links": [], "mappingType": 1, "mappingTypes": [ { "name": "value to text", "value": 1 }, { "name": "range to text", "value": 2 } ], "maxDataPoints": 100, "minSpan": 4, "nullPointMode": "null", "nullText": null, "postfix": "", "postfixFontSize": "50%", "prefix": "", "prefixFontSize": "50%", "rangeMaps": [ { "from": "null", "text": "N/A", "to": "null" } ], "repeat": null, "repeatDirection": "h", "sparkline": { "fillColor": "rgba(31, 118, 189, 0.18)", "full": false, "lineColor": "rgb(31, 120, 193)", "show": true }, "tableColumn": "", "targets": [ { "expr": "100 - ((node_filesystem_avail_bytes{instance=~\"$node\",mountpoint=\"$maxmount\",fstype=~\"ext4|xfs\"} * 100) / node_filesystem_size_bytes {instance=~\"$node\",mountpoint=\"$maxmount\",fstype=~\"ext4|xfs\"})", "format": "time_series", "interval": "10s", "intervalFactor": 1, "refId": "A", "step": 20 } ], "thresholds": "70,90", "title": "最大分区($maxmount)使用率", "type": "singlestat", "valueFontSize": "80%", "valueMaps": [ { "op": "=", "text": "N/A", "value": "null" } ], "valueName": "current" }, { "cacheTimeout": null, "colorBackground": false, "colorValue": true, "colors": [ "rgba(245, 54, 54, 0.9)", "rgba(237, 129, 40, 0.89)", "rgba(50, 172, 45, 0.97)" ], "datasource": "${DS_PROMETHEUS_111}", "decimals": null, "description": "", "format": "bytes", "gauge": { "maxValue": 100, "minValue": 0, "show": false, "thresholdLabels": false, "thresholdMarkers": true }, "gridPos": { "h": 3, "w": 2, "x": 2, "y": 3 }, "id": 75, "interval": null, "links": [], "mappingType": 1, "mappingTypes": [ { "name": "value to text", "value": 1 }, { "name": "range to text", "value": 2 } ], "maxDataPoints": 100, "minSpan": 4, "nullPointMode": "null", "nullText": null, "postfix": "", "postfixFontSize": "70%", "prefix": "", "prefixFontSize": "50%", "rangeMaps": [ { "from": "null", "text": "N/A", "to": "null" } ], "sparkline": { "fillColor": "rgba(31, 118, 189, 0.18)", "full": false, "lineColor": "rgb(31, 120, 193)", "show": false }, "tableColumn": "", "targets": [ { "expr": "node_memory_MemTotal_bytes{instance=~\"$node\"}", "format": "time_series", "instant": true, "intervalFactor": 1, "legendFormat": "{{instance}}", "refId": "A", "step": 20 } ], "thresholds": "2,3", "title": "内存总量", "type": "singlestat", "valueFontSize": "80%", "valueMaps": [ { "op": "=", "text": "N/A", "value": "null" } ], "valueName": "current" }, { "aliasColors": { "15分钟": "#6ED0E0", "1分钟": "#BF1B00", "5分钟": "#CCA300" }, "bars": false, "dashLength": 10, "dashes": false, "datasource": "${DS_PROMETHEUS_111}", "editable": true, "error": false, "fill": 1, "grid": {}, "gridPos": { "h": 6, "w": 11, "x": 0, "y": 6 }, "height": "300", "id": 13, "legend": { "alignAsTable": true, "avg": false, "current": true, "max": false, "min": false, "rightSide": true, "show": true, "total": false, "values": true }, "lines": true, "linewidth": 2, "links": [], "minSpan": 4, "nullPointMode": "null as zero", "percentage": false, "pointradius": 5, "points": false, "renderer": "flot", "repeat": null, "seriesOverrides": [], "spaceLength": 10, "stack": false, "steppedLine": false, "targets": [ { "expr": "node_load1{instance=~\"$node\"}", "format": "time_series", "instant": false, "interval": "10s", "intervalFactor": 2, "legendFormat": "{{instance}}_1m", "metric": "", "refId": "A", "step": 20, "target": "" }, { "expr": "node_load5{instance=~\"$node\"}", "format": "time_series", "instant": false, "interval": "10s", "intervalFactor": 2, "legendFormat": "{{instance}}_5m", "refId": "B", "step": 20 }, { "expr": "node_load15{instance=~\"$node\"}", "format": "time_series", "instant": false, "interval": "10s", "intervalFactor": 2, "legendFormat": "{{instance}}_15m", "refId": "C", "step": 20 } ], "thresholds": [], "timeFrom": null, "timeRegions": [], "timeShift": null, "title": "系统平均负载", "tooltip": { "msResolution": false, "shared": true, "sort": 0, "value_type": "cumulative" }, "type": "graph", "xaxis": { "buckets": null, "mode": "time", "name": null, "show": true, "values": [] }, "yaxes": [ { "format": "short", "logBase": 1, "max": null, "min": null, "show": true }, { "format": "short", "logBase": 1, "max": null, "min": null, "show": true } ], "yaxis": { "align": false, "alignLevel": null } }, { "aliasColors": { "/": "#eab839", "/boot": "#bf1b00", "/data": "#1f78c1" }, "breakPoint": "100%", "cacheTimeout": null, "combine": { "label": "Others", "threshold": "" }, "datasource": "${DS_PROMETHEUS_111}", "decimals": 1, "fontSize": "50%", "format": "bytes", "gridPos": { "h": 6, "w": 5, "x": 11, "y": 6 }, "hideTimeOverride": false, "id": 171, "interval": null, "legend": { "header": "", "percentage": false, "percentageDecimals": 0, "show": true, "sideWidth": 142, "values": true }, "legendType": "Right side", "links": [], "maxDataPoints": 3, "nullPointMode": "connected", "pieType": "pie", "strokeWidth": "2", "targets": [ { "expr": "node_filesystem_size_bytes {instance=~\"$node\",fstype=~\"ext4|xfs\"}", "format": "time_series", "instant": true, "interval": "10s", "intervalFactor": 1, "legendFormat": "{{mountpoint}}", "refId": "A" } ], "title": "磁盘总空间", "type": "grafana-piechart-panel", "valueName": "current" }, { "columns": [], "datasource": "${DS_PROMETHEUS_111}", "fontSize": "120%", "gridPos": { "h": 6, "w": 8, "x": 16, "y": 6 }, "id": 164, "links": [], "pageSize": null, "scroll": true, "showHeader": true, "sort": { "col": 6, "desc": false }, "styles": [ { "alias": "Time", "dateFormat": "YYYY-MM-DD HH:mm:ss", "pattern": "Time", "type": "hidden" }, { "alias": "分区", "colorMode": null, "colors": [ "rgba(50, 172, 45, 0.97)", "rgba(237, 129, 40, 0.89)", "rgba(245, 54, 54, 0.9)" ], "dateFormat": "YYYY-MM-DD HH:mm:ss", "decimals": 2, "mappingType": 1, "pattern": "mountpoint", "thresholds": [ "" ], "type": "string", "unit": "bytes" }, { "alias": "可用空间", "colorMode": "value", "colors": [ "rgba(245, 54, 54, 0.9)", "rgba(237, 129, 40, 0.89)", "rgba(50, 172, 45, 0.97)" ], "dateFormat": "YYYY-MM-DD HH:mm:ss", "decimals": 2, "mappingType": 1, "pattern": "Value #A", "thresholds": [ "10000000000", "20000000000" ], "type": "number", "unit": "bytes" }, { "alias": "使用率", "colorMode": "cell", "colors": [ "rgba(50, 172, 45, 0.97)", "rgba(237, 129, 40, 0.89)", "rgba(245, 54, 54, 0.9)" ], "dateFormat": "YYYY-MM-DD HH:mm:ss", "decimals": 2, "mappingType": 1, "pattern": "Value #B", "thresholds": [ "70", "90" ], "type": "number", "unit": "percentunit" }, { "alias": "总空间", "colorMode": null, "colors": [ "rgba(245, 54, 54, 0.9)", "rgba(237, 129, 40, 0.89)", "rgba(50, 172, 45, 0.97)" ], "dateFormat": "YYYY-MM-DD HH:mm:ss", "decimals": 1, "link": false, "mappingType": 1, "pattern": "Value #C", "thresholds": [], "type": "number", "unit": "bytes" }, { "alias": "文件系统", "colorMode": null, "colors": [ "rgba(245, 54, 54, 0.9)", "rgba(237, 129, 40, 0.89)", "rgba(50, 172, 45, 0.97)" ], "dateFormat": "YYYY-MM-DD HH:mm:ss", "decimals": 2, "link": false, "mappingType": 1, "pattern": "fstype", "thresholds": [], "type": "number", "unit": "short" }, { "alias": "IP", "colorMode": null, "colors": [ "rgba(245, 54, 54, 0.9)", "rgba(237, 129, 40, 0.89)", "rgba(50, 172, 45, 0.97)" ], "dateFormat": "YYYY-MM-DD HH:mm:ss", "decimals": 2, "link": false, "mappingType": 1, "pattern": "instance", "thresholds": [], "type": "number", "unit": "short" }, { "alias": "", "colorMode": null, "colors": [ "rgba(245, 54, 54, 0.9)", "rgba(237, 129, 40, 0.89)", "rgba(50, 172, 45, 0.97)" ], "decimals": 2, "pattern": "/.*/", "preserveFormat": true, "sanitize": false, "thresholds": [], "type": "hidden", "unit": "short" } ], "targets": [ { "expr": "node_filesystem_size_bytes{instance=~'$node',fstype=~\"ext4|xfs\"}", "format": "table", "hide": true, "instant": true, "intervalFactor": 1, "legendFormat": "", "refId": "C" }, { "expr": "node_filesystem_avail_bytes {instance=~'$node',fstype=~\"ext4|xfs\"}", "format": "table", "hide": false, "instant": true, "interval": "10s", "intervalFactor": 1, "legendFormat": "", "refId": "A" }, { "expr": "1-(node_filesystem_free_bytes{instance=~'$node',fstype=~\"ext4|xfs\"} / node_filesystem_size_bytes{instance=~'$node',fstype=~\"ext4|xfs\"})", "format": "table", "hide": false, "instant": true, "intervalFactor": 1, "legendFormat": "", "refId": "B" }, { "expr": "", "format": "table", "interval": "10s", "intervalFactor": 1, "legendFormat": "", "refId": "D" } ], "title": "各分区可用空间", "transform": "table", "transparent": false, "type": "table" }, { "aliasColors": { "Idle - Waiting for something to happen": "#052B51", "guest": "#9AC48A", "idle": "#052B51", "iowait": "#EAB839", "irq": "#BF1B00", "nice": "#C15C17", "sdb_每秒I/O操作%": "#d683ce", "softirq": "#E24D42", "steal": "#FCE2DE", "system": "#508642", "user": "#5195CE", "磁盘花费在I/O操作占比": "#ba43a9" }, "bars": false, "dashLength": 10, "dashes": false, "datasource": "${DS_PROMETHEUS_111}", "decimals": 2, "description": "node_disk_io_time_seconds_total:\n磁盘花费在输入/输出操作上的毫秒数。该值为累加值。(Milliseconds Spent Doing I/Os)\n\nirate(node_disk_io_time_seconds_total[1m]):\n计算每秒的速率:(last值-last前一个值)/时间戳差值,即:1秒钟内磁盘花费在I/O操作的时间占比。", "fill": 1, "gridPos": { "h": 7, "w": 16, "x": 0, "y": 12 }, "id": 7, "legend": { "alignAsTable": true, "avg": true, "current": true, "hideEmpty": true, "hideZero": true, "max": true, "min": false, "rightSide": true, "show": true, "sideWidth": null, "sort": null, "sortDesc": null, "total": false, "values": true }, "lines": true, "linewidth": 1, "links": [], "minSpan": 4, "nullPointMode": "null", "percentage": false, "pointradius": 5, "points": false, "renderer": "flot", "repeat": null, "seriesOverrides": [], "spaceLength": 10, "stack": false, "steppedLine": false, "targets": [ { "expr": "avg(irate(node_cpu_seconds_total{instance=~\"$node\",mode=\"system\"}[1m])) by (instance)", "format": "time_series", "hide": false, "instant": false, "interval": "", "intervalFactor": 2, "legendFormat": "{{instance}}_System", "refId": "A", "step": 20 }, { "expr": "avg(irate(node_cpu_seconds_total{instance=~\"$node\",mode=\"user\"}[1m])) by (instance)", "format": "time_series", "hide": false, "intervalFactor": 2, "legendFormat": "{{instance}}_User", "refId": "B", "step": 240 }, { "expr": "avg(irate(node_cpu_seconds_total{instance=~\"$node\",mode=\"idle\"}[1m])) by (instance)", "format": "time_series", "hide": true, "intervalFactor": 2, "legendFormat": "{{instance}}_Idle", "refId": "F", "step": 240 }, { "expr": "avg(irate(node_cpu_seconds_total{instance=~\"$node\",mode=\"iowait\"}[1m])) by (instance)", "format": "time_series", "hide": false, "intervalFactor": 2, "legendFormat": "{{instance}}_Iowait", "refId": "D", "step": 240 }, { "expr": "irate(node_disk_io_time_seconds_total{instance=~\"$node\"}[1m])", "format": "time_series", "intervalFactor": 1, "legendFormat": "{{instance}}_{{device}}_每秒I/O操作%", "refId": "C" } ], "thresholds": [], "timeFrom": null, "timeRegions": [], "timeShift": null, "title": "CPU使用率、磁盘每秒的I/O操作耗费时间(%)", "tooltip": { "shared": true, "sort": 0, "value_type": "individual" }, "transparent": false, "type": "graph", "xaxis": { "buckets": null, "mode": "time", "name": null, "show": true, "values": [] }, "yaxes": [ { "decimals": null, "format": "percentunit", "label": "", "logBase": 1, "max": "1", "min": null, "show": true }, { "format": "short", "label": null, "logBase": 1, "max": null, "min": null, "show": false } ], "yaxis": { "align": false, "alignLevel": null } }, { "aliasColors": { "内存_Avaliable": "#6ED0E0", "内存_Cached": "#EF843C", "内存_Free": "#629E51", "内存_Total": "#6d1f62", "内存_Used": "#eab839", "可用": "#9ac48a", "总内存": "#bf1b00" }, "bars": false, "dashLength": 10, "dashes": false, "datasource": "${DS_PROMETHEUS_111}", "decimals": 2, "fill": 6, "gridPos": { "h": 7, "w": 8, "x": 16, "y": 12 }, "height": "300", "id": 156, "legend": { "alignAsTable": true, "avg": false, "current": true, "max": false, "min": false, "rightSide": false, "show": true, "sort": "current", "sortDesc": true, "total": false, "values": true }, "lines": true, "linewidth": 3, "links": [], "nullPointMode": "null", "percentage": false, "pointradius": 5, "points": false, "renderer": "flot", "seriesOverrides": [], "spaceLength": 10, "stack": false, "steppedLine": false, "targets": [ { "expr": "node_memory_MemTotal_bytes{instance=~\"$node\"}", "format": "time_series", "hide": false, "instant": false, "intervalFactor": 2, "legendFormat": "{{instance}}_总内存", "refId": "A", "step": 4 }, { "expr": "node_memory_MemTotal_bytes{instance=~\"$node\"} - node_memory_MemAvailable_bytes{instance=~\"$node\"}", "format": "time_series", "hide": false, "intervalFactor": 2, "legendFormat": "{{instance}}_已用", "refId": "B", "step": 4 }, { "expr": "node_memory_MemFree_bytes{instance=~\"$node\"}", "format": "time_series", "hide": true, "intervalFactor": 2, "legendFormat": "内存_Free", "refId": "C", "step": 4 }, { "expr": "node_memory_Buffers_bytes{instance=~\"$node\"}", "format": "time_series", "hide": true, "intervalFactor": 2, "legendFormat": "内存_Buffers", "refId": "D", "step": 4 }, { "expr": "node_memory_Cached_bytes{instance=~\"$node\"}", "format": "time_series", "hide": true, "intervalFactor": 2, "legendFormat": "内存_Cached", "refId": "E", "step": 4 }, { "expr": "node_memory_MemAvailable_bytes{instance=~\"$node\"}", "format": "time_series", "hide": false, "interval": "", "intervalFactor": 2, "legendFormat": "{{instance}}_可用", "refId": "F", "step": 4 }, { "expr": "node_memory_MemTotal_bytes{instance=~\"$node\"} - (node_memory_Cached_bytes{instance=~\"$node\"} + node_memory_Buffers_bytes{instance=~\"$node\"} + node_memory_MemFree_bytes{instance=~\"$node\"})", "format": "time_series", "hide": true, "intervalFactor": 1, "refId": "G" } ], "thresholds": [], "timeFrom": null, "timeRegions": [], "timeShift": null, "title": "内存信息", "tooltip": { "shared": true, "sort": 0, "value_type": "individual" }, "type": "graph", "xaxis": { "buckets": null, "mode": "time", "name": null, "show": true, "values": [] }, "yaxes": [ { "format": "bytes", "label": null, "logBase": 1, "max": null, "min": "0", "show": true }, { "format": "short", "label": null, "logBase": 1, "max": null, "min": null, "show": true } ], "yaxis": { "align": false, "alignLevel": null } }, { "aliasColors": { "vda_write": "#6ED0E0" }, "bars": true, "dashLength": 10, "dashes": false, "datasource": "${DS_PROMETHEUS_111}", "description": "Reads completed: 每个磁盘分区每秒读完成次数\n\nWrites completed: 每个磁盘分区每秒写完成次数\n\nIO now 每个磁盘分区每秒正在处理的输入/输出请求数", "fill": 2, "gridPos": { "h": 8, "w": 6, "x": 0, "y": 19 }, "height": "300", "id": 161, "legend": { "alignAsTable": true, "avg": false, "current": true, "hideEmpty": true, "hideZero": true, "max": true, "min": false, "show": true, "sort": "current", "sortDesc": true, "total": false, "values": true }, "lines": false, "linewidth": 1, "links": [], "nullPointMode": "null", "percentage": false, "pointradius": 5, "points": false, "renderer": "flot", "seriesOverrides": [ { "alias": "/.*_读取$/", "transform": "negative-Y" } ], "spaceLength": 10, "stack": false, "steppedLine": false, "targets": [ { "expr": "irate(node_disk_reads_completed_total{instance=~\"$node\"}[1m])", "format": "time_series", "hide": false, "interval": "", "intervalFactor": 2, "legendFormat": "{{instance}}_{{device}}_读取", "refId": "A", "step": 10 }, { "expr": "irate(node_disk_writes_completed_total{instance=~\"$node\"}[1m])", "format": "time_series", "hide": false, "intervalFactor": 2, "legendFormat": "{{instance}}_{{device}}_写入", "refId": "B", "step": 10 }, { "expr": "node_disk_io_now{instance=~\"$node\"}", "format": "time_series", "hide": true, "interval": "", "intervalFactor": 1, "legendFormat": "{{device}}", "refId": "C" } ], "thresholds": [], "timeFrom": null, "timeRegions": [], "timeShift": null, "title": "磁盘读写速率(IOPS)", "tooltip": { "shared": true, "sort": 0, "value_type": "individual" }, "type": "graph", "xaxis": { "buckets": null, "mode": "time", "name": null, "show": true, "values": [] }, "yaxes": [ { "decimals": null, "format": "iops", "label": "读取(-)/写入(+)I/O ops/sec", "logBase": 1, "max": null, "min": null, "show": true }, { "format": "short", "label": null, "logBase": 1, "max": null, "min": null, "show": true } ], "yaxis": { "align": false, "alignLevel": null } }, { "aliasColors": { "vda_write": "#6ED0E0" }, "bars": true, "dashLength": 10, "dashes": false, "datasource": "${DS_PROMETHEUS_111}", "description": "Read bytes 每个磁盘分区每秒读取的比特数\nWritten bytes 每个磁盘分区每秒写入的比特数", "fill": 2, "gridPos": { "h": 8, "w": 6, "x": 6, "y": 19 }, "height": "300", "id": 168, "legend": { "alignAsTable": true, "avg": false, "current": true, "hideEmpty": true, "hideZero": true, "max": true, "min": false, "show": true, "total": false, "values": true }, "lines": false, "linewidth": 1, "links": [], "nullPointMode": "null", "percentage": false, "pointradius": 5, "points": false, "renderer": "flot", "seriesOverrides": [ { "alias": "/.*_读取$/", "transform": "negative-Y" } ], "spaceLength": 10, "stack": false, "steppedLine": false, "targets": [ { "expr": "irate(node_disk_read_bytes_total{instance=~\"$node\"}[1m])", "format": "time_series", "interval": "", "intervalFactor": 2, "legendFormat": "{{instance}}_{{device}}_读取", "refId": "A", "step": 10 }, { "expr": "irate(node_disk_written_bytes_total{instance=~\"$node\"}[1m])", "format": "time_series", "hide": false, "intervalFactor": 2, "legendFormat": "{{instance}}_{{device}}_写入", "refId": "B", "step": 10 } ], "thresholds": [], "timeFrom": null, "timeRegions": [], "timeShift": null, "title": "磁盘读写容量大小", "tooltip": { "shared": true, "sort": 0, "value_type": "individual" }, "type": "graph", "xaxis": { "buckets": null, "mode": "time", "name": null, "show": true, "values": [] }, "yaxes": [ { "decimals": null, "format": "Bps", "label": "读取(-)/写入(+)", "logBase": 1, "max": null, "min": null, "show": true }, { "format": "short", "label": null, "logBase": 1, "max": null, "min": null, "show": false } ], "yaxis": { "align": false, "alignLevel": null } }, { "aliasColors": { "vda": "#6ED0E0" }, "bars": false, "dashLength": 10, "dashes": false, "datasource": "${DS_PROMETHEUS_111}", "description": "Read time ms 每个磁盘分区读操作花费的秒数\n\nWrite time ms 每个磁盘分区写操作花费的秒数\n\nIO time ms 每个磁盘分区输入/输出操作花费的秒数\n\nIO time weighted 每个磁盘分区输入/输出操作花费的加权秒数", "fill": 3, "gridPos": { "h": 8, "w": 6, "x": 12, "y": 19 }, "height": "300", "id": 160, "legend": { "alignAsTable": true, "avg": false, "current": true, "hideEmpty": true, "hideZero": true, "max": true, "min": false, "show": true, "total": false, "values": true }, "lines": true, "linewidth": 1, "links": [], "nullPointMode": "null", "percentage": false, "pointradius": 5, "points": false, "renderer": "flot", "seriesOverrides": [ { "alias": "/,*_读取$/", "transform": "negative-Y" } ], "spaceLength": 10, "stack": false, "steppedLine": false, "targets": [ { "expr": "irate(node_disk_io_time_seconds_total{instance=~\"$node\"}[1m])", "format": "time_series", "hide": true, "interval": "", "intervalFactor": 2, "legendFormat": "{{device}}", "refId": "A", "step": 10 }, { "expr": "irate(node_disk_io_time_weighted_seconds_total{instance=~\"$node\"}[1m])", "format": "time_series", "hide": true, "intervalFactor": 1, "legendFormat": "{{device}}_加权", "refId": "D" }, { "expr": "irate(node_disk_read_time_seconds_total{instance=~\"$node\"}[1m])", "format": "time_series", "hide": false, "interval": "", "intervalFactor": 1, "legendFormat": "{{instance}}_{{device}}_读取", "refId": "B" }, { "expr": "irate(node_disk_write_time_seconds_total{instance=~\"$node\"}[1m])", "format": "time_series", "hide": false, "intervalFactor": 1, "legendFormat": "{{instance}}_{{device}}_写入", "refId": "C" } ], "thresholds": [], "timeFrom": null, "timeRegions": [], "timeShift": null, "title": "磁盘IO读写时间", "tooltip": { "shared": true, "sort": 0, "value_type": "individual" }, "type": "graph", "xaxis": { "buckets": null, "mode": "time", "name": null, "show": true, "values": [] }, "yaxes": [ { "format": "s", "label": "读取(-)/写入(+)", "logBase": 1, "max": null, "min": null, "show": true }, { "format": "short", "label": null, "logBase": 1, "max": null, "min": null, "show": false } ], "yaxis": { "align": false, "alignLevel": null } }, { "aliasColors": {}, "bars": false, "dashLength": 10, "dashes": false, "fill": 1, "gridPos": { "h": 8, "w": 6, "x": 18, "y": 19 }, "id": 174, "legend": { "alignAsTable": true, "avg": false, "current": true, "hideEmpty": false, "hideZero": false, "max": false, "min": false, "rightSide": false, "show": true, "total": false, "values": true }, "lines": true, "linewidth": 1, "links": [], "nullPointMode": "null", "percentage": false, "pointradius": 5, "points": false, "renderer": "flot", "seriesOverrides": [], "spaceLength": 10, "stack": false, "steppedLine": false, "targets": [ { "expr": "1-(node_filesystem_free_bytes{instance=~'$node',fstype=~\"ext4|xfs\"} / node_filesystem_size_bytes{instance=~'$node',fstype=~\"ext4|xfs\"})", "format": "time_series", "intervalFactor": 1, "legendFormat": "{{instance}}:{{mountpoint}}", "refId": "A" } ], "thresholds": [], "timeFrom": null, "timeRegions": [], "timeShift": null, "title": "分时磁盘使用率", "tooltip": { "shared": true, "sort": 0, "value_type": "individual" }, "type": "graph", "xaxis": { "buckets": null, "mode": "time", "name": null, "show": true, "values": [] }, "yaxes": [ { "format": "percentunit", "label": null, "logBase": 1, "max": "1", "min": null, "show": true }, { "format": "short", "label": null, "logBase": 1, "max": null, "min": null, "show": true } ], "yaxis": { "align": false, "alignLevel": null } }, { "aliasColors": {}, "bars": false, "dashLength": 10, "dashes": false, "datasource": "${DS_PROMETHEUS_111}", "fill": 1, "gridPos": { "h": 8, "w": 12, "x": 0, "y": 27 }, "height": "300", "id": 157, "legend": { "alignAsTable": true, "avg": false, "current": true, "hideEmpty": true, "hideZero": true, "max": false, "min": false, "rightSide": true, "show": true, "sort": "current", "sortDesc": true, "total": false, "values": true }, "lines": true, "linewidth": 2, "links": [], "nullPointMode": "null", "percentage": false, "pointradius": 5, "points": false, "renderer": "flot", "seriesOverrides": [ { "alias": "/.*_out上传$/", "transform": "negative-Y" } ], "spaceLength": 10, "stack": false, "steppedLine": false, "targets": [ { "expr": "irate(node_network_receive_bytes_total{instance=~'$node',device!~'tap.*|veth.*|br.*|docker.*|virbr*|lo*'}[5m])*8", "format": "time_series", "intervalFactor": 2, "legendFormat": "{{instance}}_{{device}}_in下载", "refId": "A", "step": 4 }, { "expr": "irate(node_network_transmit_bytes_total{instance=~'$node',device!~'tap.*|veth.*|br.*|docker.*|virbr*|lo*'}[5m])*8", "format": "time_series", "intervalFactor": 2, "legendFormat": "{{instance}}_{{device}}_out上传", "refId": "B", "step": 4 } ], "thresholds": [], "timeFrom": null, "timeRegions": [], "timeShift": null, "title": "网络流量", "tooltip": { "shared": true, "sort": 0, "value_type": "individual" }, "type": "graph", "xaxis": { "buckets": null, "mode": "time", "name": null, "show": true, "values": [] }, "yaxes": [ { "format": "bps", "label": "上传(-)/下载(+)", "logBase": 1, "max": null, "min": null, "show": true }, { "format": "short", "label": null, "logBase": 1, "max": null, "min": null, "show": false } ], "yaxis": { "align": false, "alignLevel": null } }, { "aliasColors": { "TCP": "#6ED0E0" }, "bars": false, "dashLength": 10, "dashes": false, "datasource": "${DS_PROMETHEUS_111}", "description": "CurrEstab - 当前状态为 ESTABLISHED 或 CLOSE-WAIT 的 TCP 连接数\n\nActiveOpens - 已从 CLOSED 状态直接转换到 SYN-SENT 状态的 TCP 平均连接数(1分钟内)\n\nPassiveOpens - 已从 LISTEN 状态直接转换到 SYN-RCVD 状态的 TCP 平均连接数(1分钟内)\n\nTCP_alloc - 已分配(已建立、已申请到sk_buff)的TCP套接字数量\n\nTCP_inuse - 正在使用(正在侦听)的TCP套接字数量\n\nTCP_tw - 等待关闭的TCP连接数", "fill": 0, "gridPos": { "h": 8, "w": 12, "x": 12, "y": 27 }, "height": "300", "id": 158, "legend": { "alignAsTable": true, "avg": false, "current": true, "max": true, "min": false, "rightSide": true, "show": true, "total": false, "values": true }, "lines": true, "linewidth": 1, "links": [], "nullPointMode": "null", "percentage": false, "pointradius": 5, "points": false, "renderer": "flot", "seriesOverrides": [], "spaceLength": 10, "stack": false, "steppedLine": false, "targets": [ { "expr": "node_netstat_Tcp_CurrEstab{instance=~'$node'}", "format": "time_series", "hide": false, "interval": "10s", "intervalFactor": 1, "legendFormat": "{{instance}}_ESTABLISHED", "refId": "A", "step": 20 }, { "expr": "node_sockstat_TCP_tw{instance=~'$node'}", "format": "time_series", "intervalFactor": 1, "legendFormat": "{{instance}}_TCP_tw", "refId": "D" }, { "expr": "irate(node_netstat_Tcp_ActiveOpens{instance=~'$node'}[1m])", "format": "time_series", "hide": false, "intervalFactor": 1, "legendFormat": "{{instance}}_ActiveOpens", "refId": "B" }, { "expr": "irate(node_netstat_Tcp_PassiveOpens{instance=~'$node'}[1m])", "format": "time_series", "intervalFactor": 1, "legendFormat": "{{instance}}_PassiveOpens", "refId": "C" }, { "expr": "node_sockstat_TCP_alloc{instance=~'$node'}", "format": "time_series", "intervalFactor": 1, "legendFormat": "{{instance}}_TCP_alloc", "refId": "E" }, { "expr": "node_sockstat_TCP_inuse{instance=~'$node'}", "format": "time_series", "intervalFactor": 1, "legendFormat": "{{instance}}_TCP_inuse", "refId": "F" } ], "thresholds": [], "timeFrom": null, "timeRegions": [], "timeShift": null, "title": "TCP 连接情况", "tooltip": { "shared": true, "sort": 0, "value_type": "individual" }, "transparent": false, "type": "graph", "xaxis": { "buckets": null, "mode": "time", "name": null, "show": true, "values": [] }, "yaxes": [ { "format": "short", "label": null, "logBase": 1, "max": null, "min": null, "show": true }, { "format": "short", "label": null, "logBase": 1, "max": null, "min": null, "show": true } ], "yaxis": { "align": false, "alignLevel": null } }, { "aliasColors": {}, "bars": false, "dashLength": 10, "dashes": false, "datasource": "${DS_PROMETHEUS_111}", "fill": 0, "gridPos": { "h": 10, "w": 24, "x": 0, "y": 35 }, "id": 169, "legend": { "alignAsTable": true, "avg": true, "current": true, "hideEmpty": true, "hideZero": true, "max": true, "min": false, "rightSide": true, "show": true, "total": false, "values": true }, "lines": true, "linewidth": 1, "links": [], "nullPointMode": "null as zero", "percentage": false, "pointradius": 0.5, "points": false, "renderer": "flot", "seriesOverrides": [], "spaceLength": 10, "stack": false, "steppedLine": false, "targets": [ { "expr": "node_hwmon_temp_celsius{instance=~'$node'}", "format": "time_series", "intervalFactor": 1, "legendFormat": "{{instance}}_{{chip}}_{{sensor}}", "refId": "A" } ], "thresholds": [], "timeFrom": null, "timeRegions": [], "timeShift": null, "title": "硬件温度", "tooltip": { "shared": true, "sort": 0, "value_type": "individual" }, "type": "graph", "xaxis": { "buckets": null, "mode": "time", "name": null, "show": true, "values": [] }, "yaxes": [ { "format": "celsius", "label": null, "logBase": 1, "max": null, "min": null, "show": true }, { "format": "short", "label": null, "logBase": 1, "max": null, "min": null, "show": true } ], "yaxis": { "align": false, "alignLevel": null } } ], "refresh": false, "schemaVersion": 16, "style": "dark", "tags": [ "Prometheus", "node_exporter", "StarsL.cn" ], "templating": { "list": [ { "auto": true, "auto_count": 10, "auto_min": "10s", "current": { "text": "5s", "value": "5s" }, "hide": 0, "label": "interval", "name": "interval", "options": [ { "selected": false, "text": "auto", "value": "$__auto_interval_interval" }, { "selected": true, "text": "5s", "value": "5s" }, { "selected": false, "text": "10s", "value": "10s" }, { "selected": false, "text": "30s", "value": "30s" }, { "selected": false, "text": "1m", "value": "1m" }, { "selected": false, "text": "10m", "value": "10m" }, { "selected": false, "text": "30m", "value": "30m" }, { "selected": false, "text": "1h", "value": "1h" }, { "selected": false, "text": "6h", "value": "6h" }, { "selected": false, "text": "12h", "value": "12h" }, { "selected": false, "text": "1d", "value": "1d" } ], "query": "5s,10s,30s,1m,10m,30m,1h,6h,12h,1d", "refresh": 2, "skipUrlSync": false, "type": "interval" }, { "allFormat": "glob", "allValue": null, "current": {}, "datasource": "${DS_PROMETHEUS_111}", "definition": "", "hide": 0, "includeAll": true, "label": "环境", "multi": true, "multiFormat": "regex values", "name": "env", "options": [], "query": "label_values(node_exporter_build_info,env)", "refresh": 2, "regex": "", "skipUrlSync": false, "sort": 1, "tagValuesQuery": "", "tags": [], "tagsQuery": "", "type": "query", "useTags": false }, { "allFormat": "glob", "allValue": "", "current": {}, "datasource": "${DS_PROMETHEUS_111}", "definition": "label_values(node_exporter_build_info{env=~'$env'},name)", "hide": 0, "includeAll": true, "label": "主机名", "multi": true, "multiFormat": "regex values", "name": "name", "options": [], "query": "label_values(node_exporter_build_info{env=~'$env'},name)", "refresh": 2, "regex": "", "skipUrlSync": false, "sort": 1, "tagValuesQuery": "/.*/", "tags": [], "tagsQuery": "", "type": "query", "useTags": false }, { "allFormat": "glob", "allValue": null, "current": {}, "datasource": "${DS_PROMETHEUS_111}", "definition": "label_values(node_exporter_build_info{name=~'$name'},instance)", "hide": 0, "includeAll": true, "label": "IP( 主机名多选时,该项请选ALL)", "multi": true, "multiFormat": "regex values", "name": "node", "options": [], "query": "label_values(node_exporter_build_info{name=~'$name'},instance)", "refresh": 2, "regex": "", "skipUrlSync": false, "sort": 1, "tagValuesQuery": "", "tags": [], "tagsQuery": "", "type": "query", "useTags": false }, { "allValue": null, "current": {}, "datasource": "${DS_PROMETHEUS_111}", "definition": "", "hide": 2, "includeAll": false, "label": "", "multi": false, "name": "maxmount", "options": [], "query": "query_result(topk(1,sort_desc (max(node_filesystem_size_bytes{instance=~'$node',fstype=~\"ext4|xfs\"}) by (mountpoint))))", "refresh": 2, "regex": "/.*\\\"(.*)\\\".*/", "skipUrlSync": false, "sort": 0, "tagValuesQuery": "", "tags": [], "tagsQuery": "", "type": "query", "useTags": false }, { "datasource": "prometheus_111", "filters": [], "hide": 0, "label": "", "name": "Filters", "skipUrlSync": false, "type": "adhoc" } ] }, "time": { "from": "now-7d", "to": "now" }, "timepicker": { "now": true, "refresh_intervals": [ "5s", "10s", "30s", "1m", "5m", "15m", "30m", "1h", "2h", "1d" ], "time_options": [ "5m", "15m", "1h", "6h", "12h", "24h", "2d", "7d", "30d" ] }, "timezone": "browser", "title": "1 Node Exporter 0.16 + for Prometheus 监控展示看板", "uid": "9CWBz0bik", "version": 65 }
效果图
自定义监控项
大神的修修改改拿来用肯定好,但是我们也需要会自己配置,后续自己的业务信息抓取配置还需靠自己。
PromQL提供了很多函数供使用,还有linux底层的东西,能否做出”美观,有价值“的监控需要靠你了。
点击加号,dashboard,创建一个仪表盘
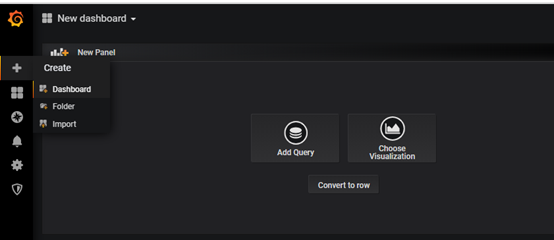
输入promql查询语句,会显示相应图形。语句可在promethes进行测试,查看值和图形,然后再配置在grafana
两个promql例子:
#cpu使用率
(1 - ((sum(increase(node_cpu_seconds_total{job="node1",mode="idle"} [1m]) ) by (instance)) /(sum(increase(node_cpu_seconds_total[1m])) by (instance)))) * 100
#开机运行时间
ceil(node_time_seconds{instance="127.0.0.1:9100",job="node1"} - node_boot_time_seconds{instance="127.0.0.1:9100",job="node1"})
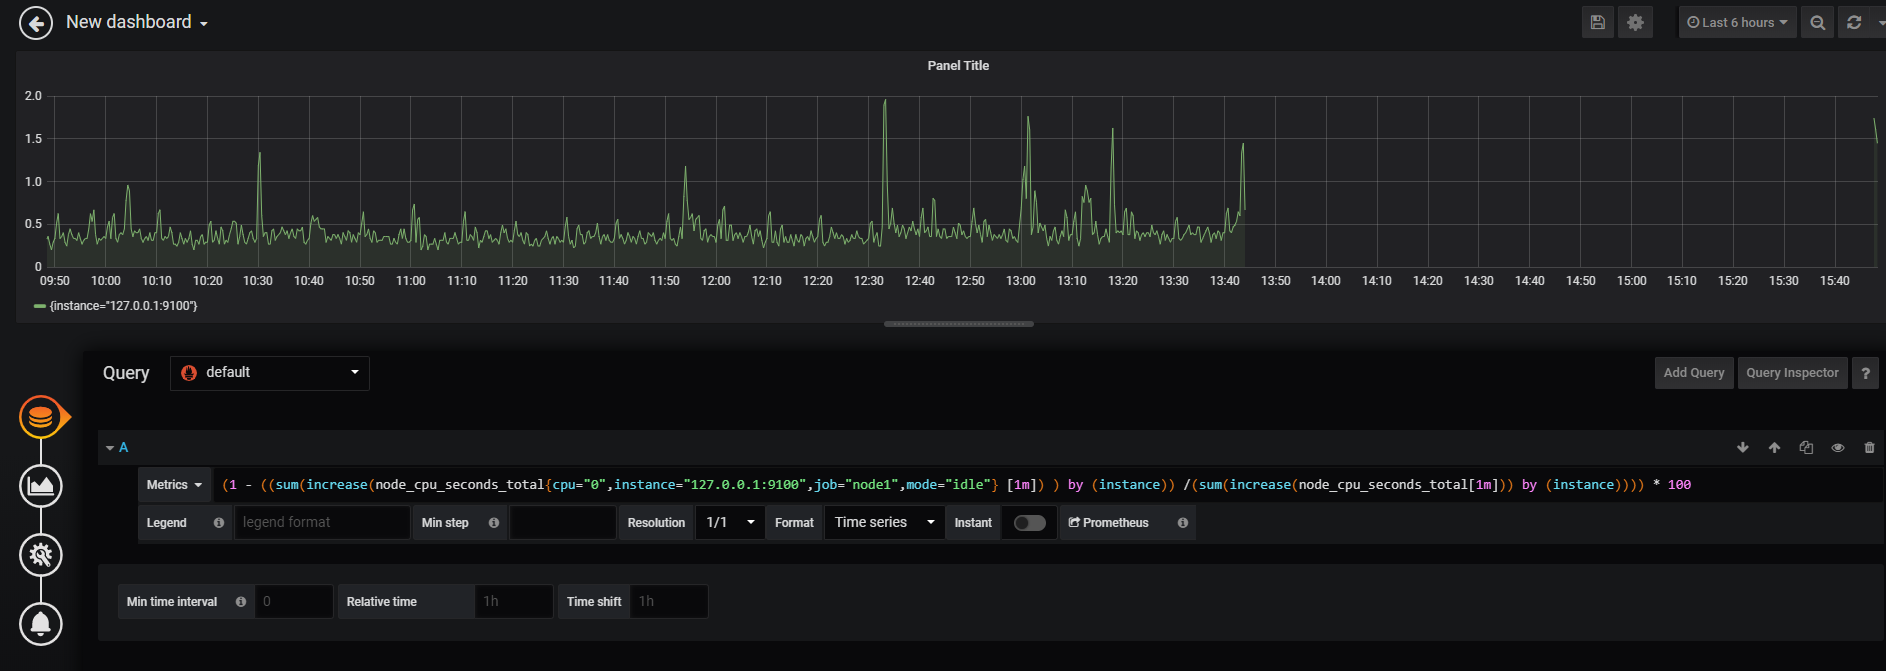
自定义监控项的详细信息设置,保存按钮在右上角

可选择自己喜欢的图形(不不不,是甲方爸爸看着舒服的图形)
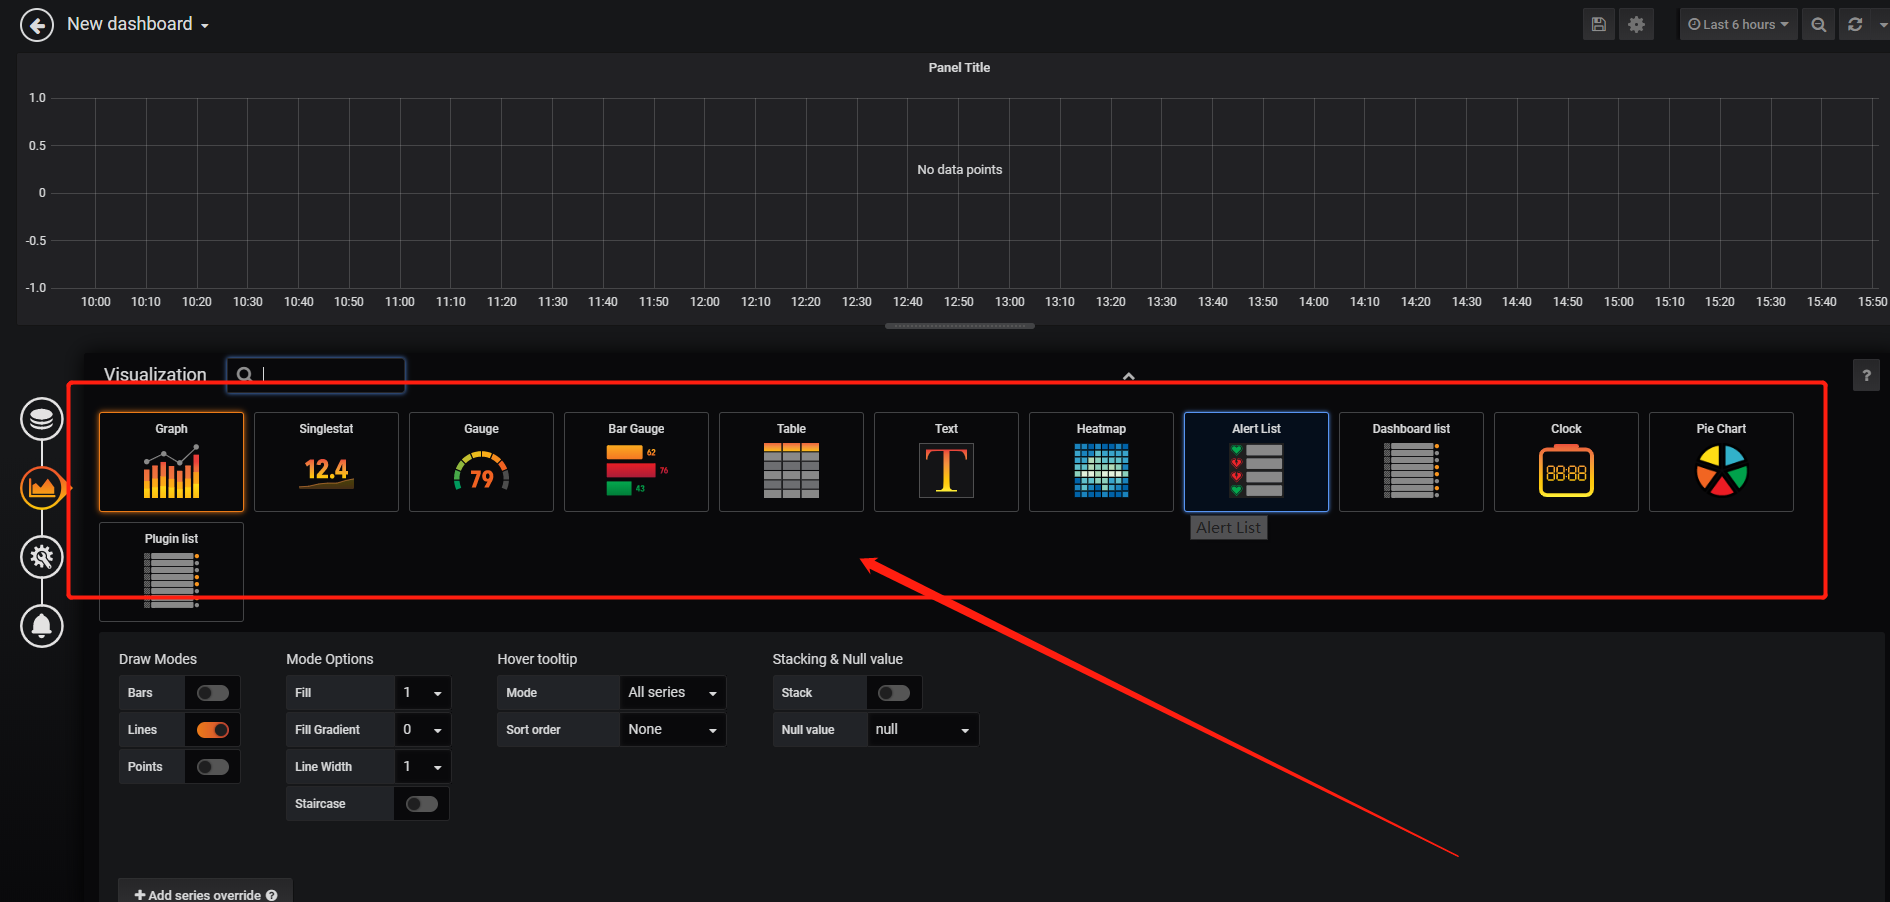
图形插件,dashboards模板等可以在grafana扩展里下载
对“自定义监控信息”和”kubernetes监控“持续学习 更新中。。。。

 浙公网安备 33010602011771号