第4篇Scrum冲刺博客
| 软件工程 | 班级链接 |
|---|---|
| 作业要求 | 作业要求 |
| 作业目标 | 项目冲刺 |
| github仓库 | 团队项目 |
队名:P人大联盟
团队成员
| 姓名 | 学号 |
|---|---|
| 王睿娴 | 3222003968 |
| 张颢严 | 3222004426 |
| 梁恬(组长) | 3222004467 |
| 潘思言 | 3222004423 |
本篇博客目录
4.2、的目录索引无法响应,其子目录可响应
1、Scrum Meeting
1.1、站立式会议照片

1.2、会议总结
| 昨日安排的任务 | 负责成员 | 实际完成情况 | 工作中遇到的困难 |
|---|---|---|---|
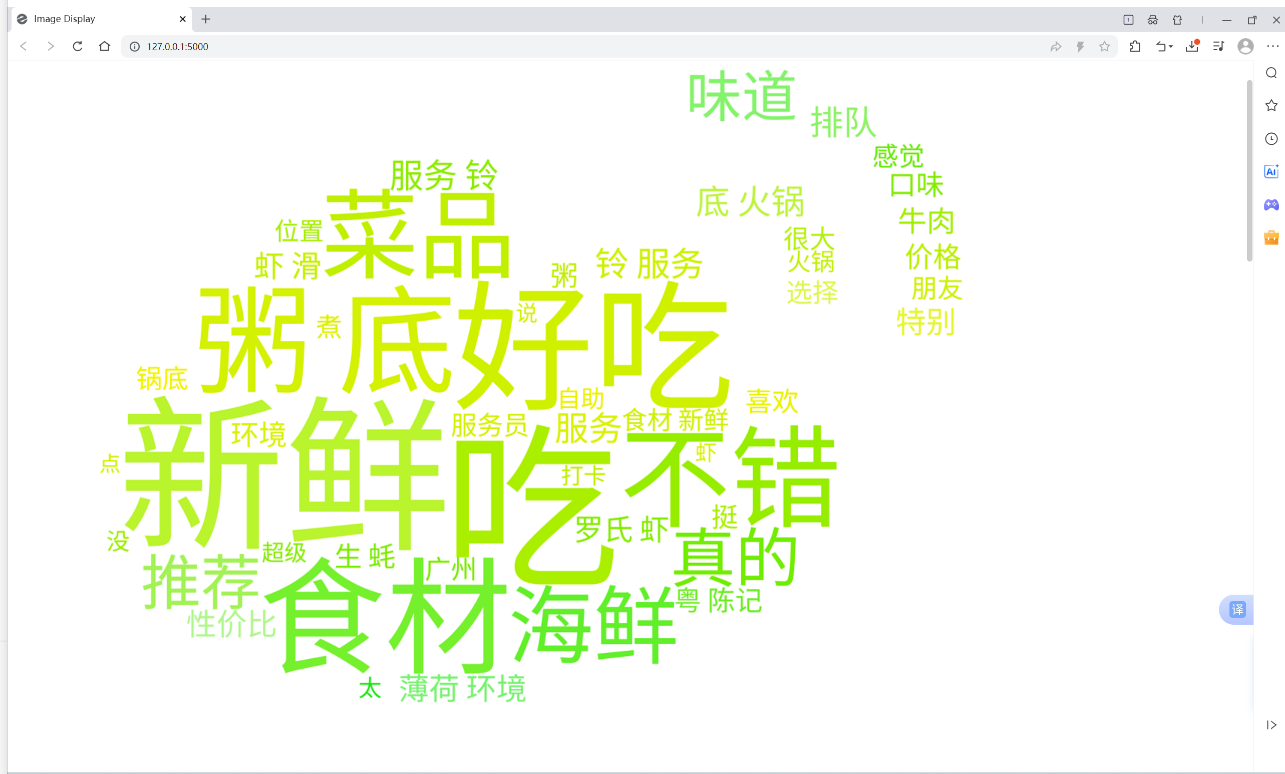
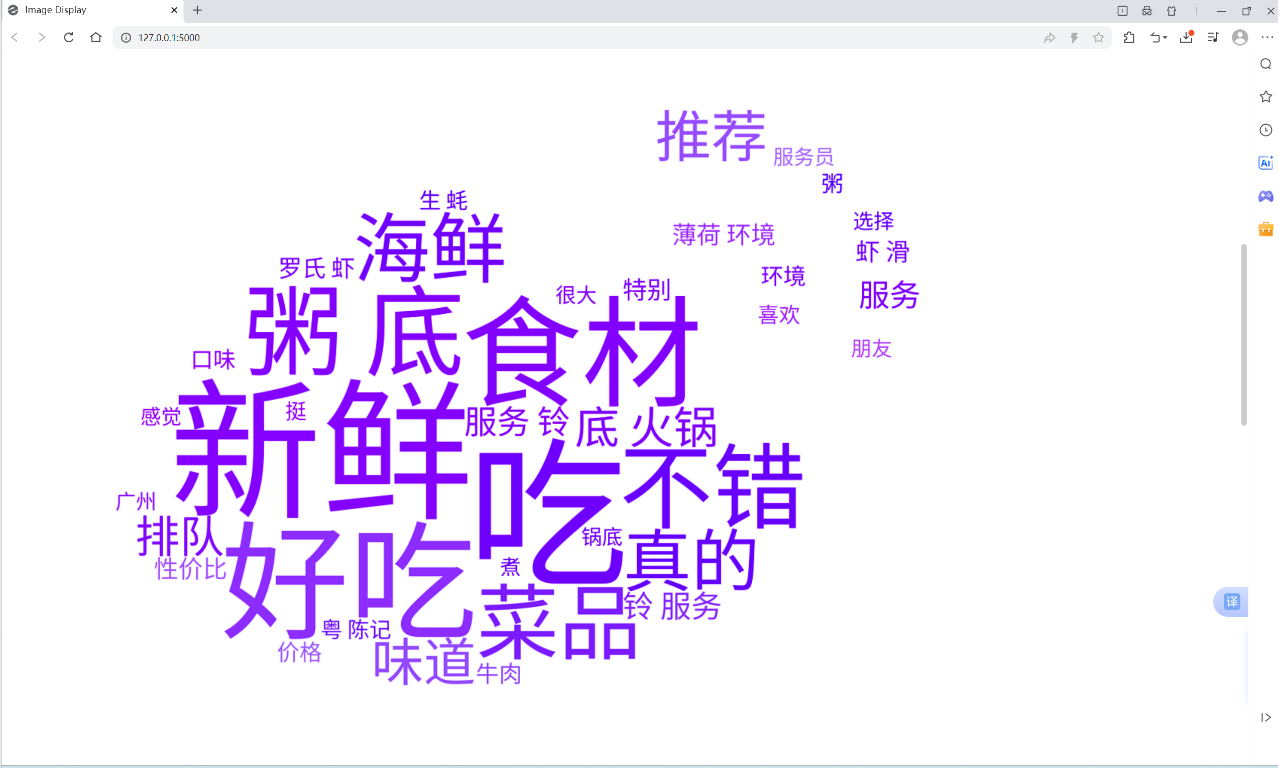
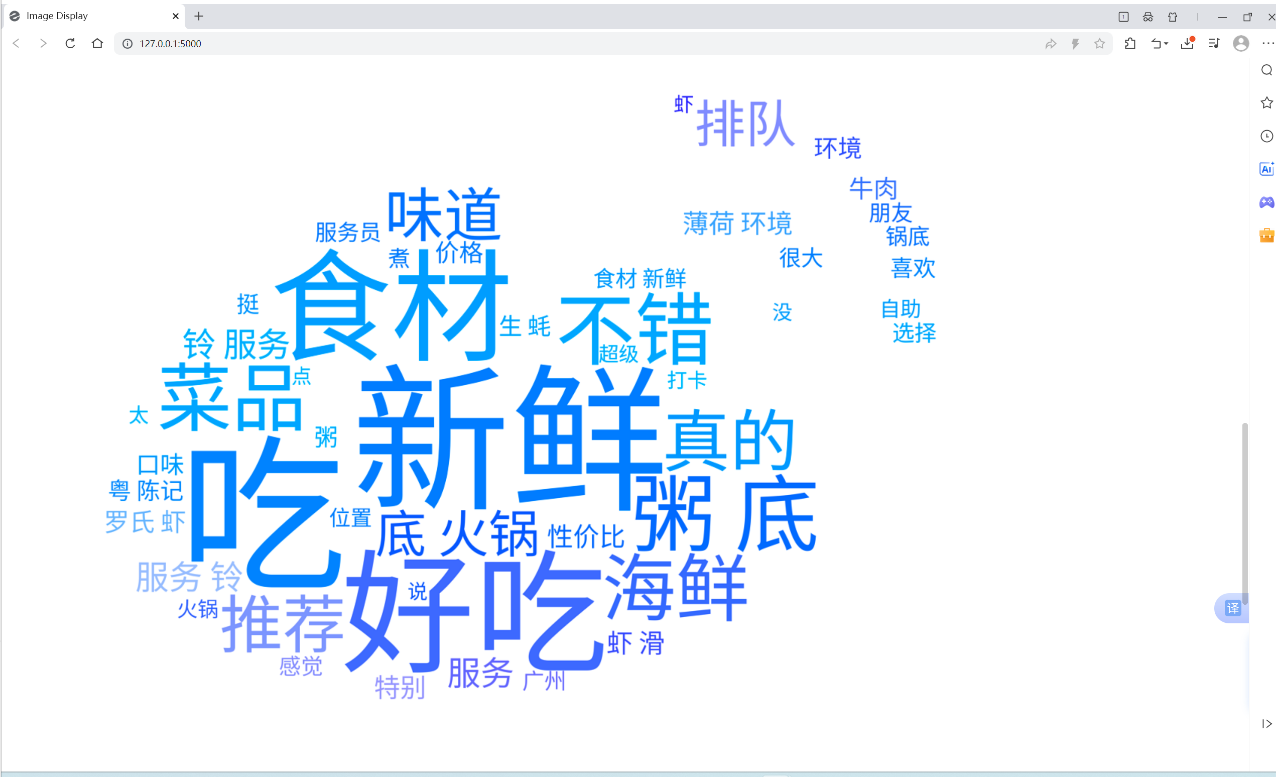
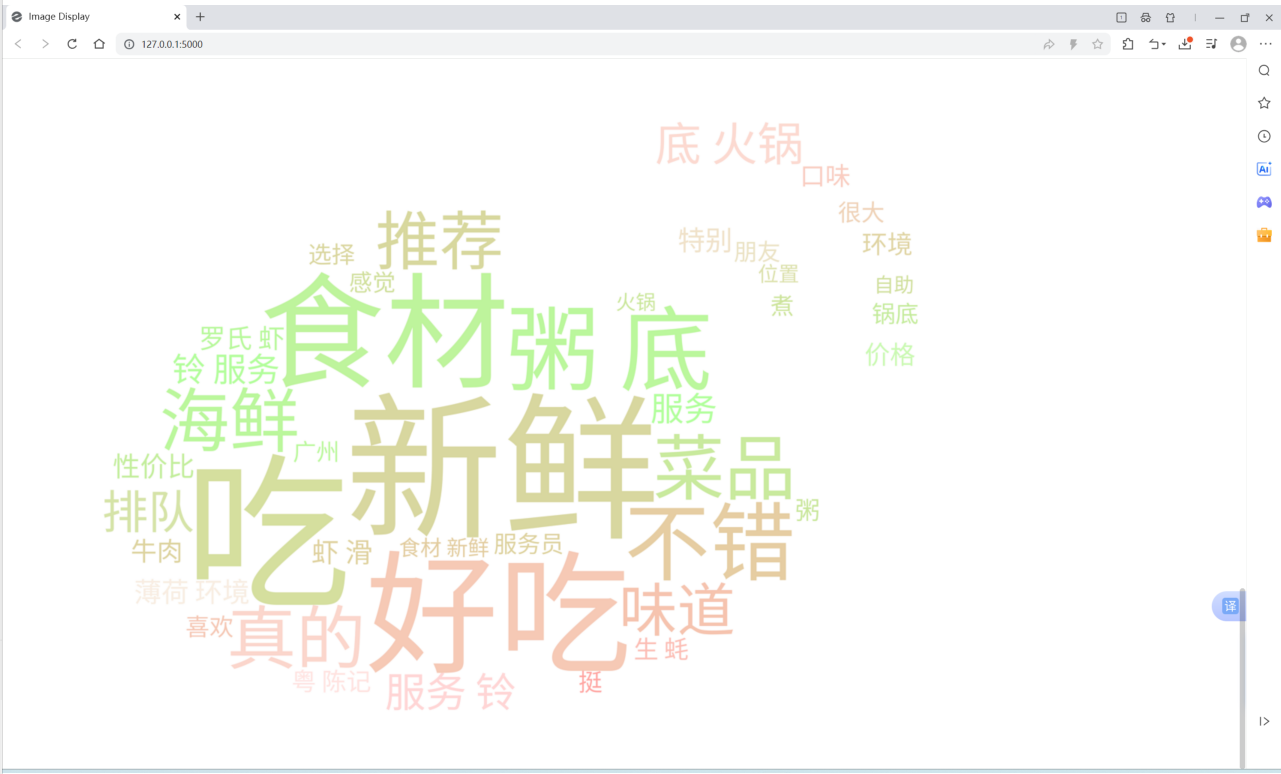
| 完成数据可视化的单元测试的全部验证,商讨确认词云样式,查询并尝试搭建部署到互联网上的架构 | 梁恬 | 单元测试全部完成,初步确定词云样式,后续会根据系统运行起来的实际效果进行微调, 部署找到了流程指导与云服务器资源 | 部署流程不熟悉,不确定该流程指导是否切合项目实际情况与需要 |
| AI建议模块初步实现 | 潘思言 | 基本完成 | 发送给AI的询问文本仍需优化 |
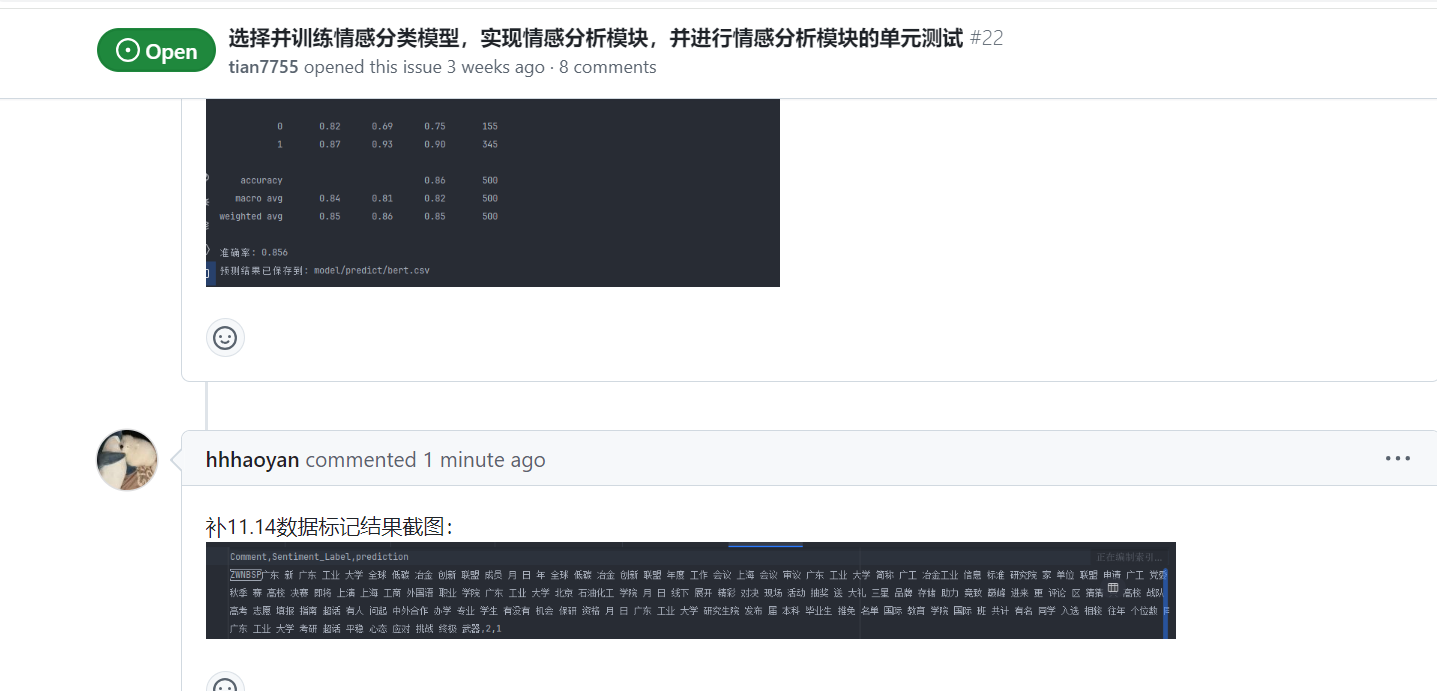
| 编写基于朴素贝叶斯分类器进行情感分析的程序,训练数据集中的微博文本,提取关键词 | 张颢严 | 程序初步完成,能够对训练数据集进行情感分析并提取关键词 | 微博文本预处理较为复杂,存在部分噪声数据需要清洗 |
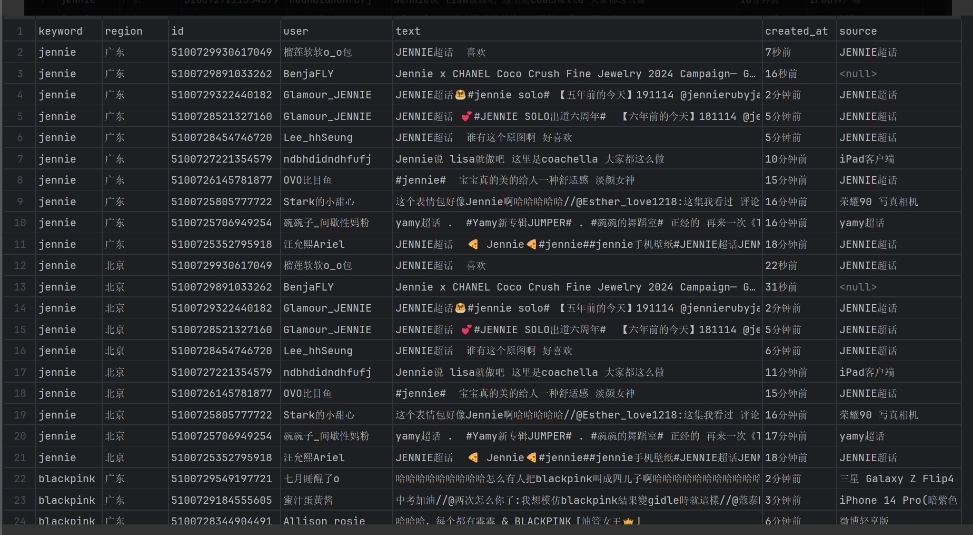
| 完善数据解析、扩展并优化URL构建逻辑、调试验证爬取结果 | 王睿娴 | 基本完成 | 在扩展和优化 URL 构建逻辑时,会遇到不同时间区间、地域等参数的处理问题,导致构建的 URL 无法正确访问或页面跳转失败。 |
| 今日计划的任务 | 负责成员 |
|---|---|
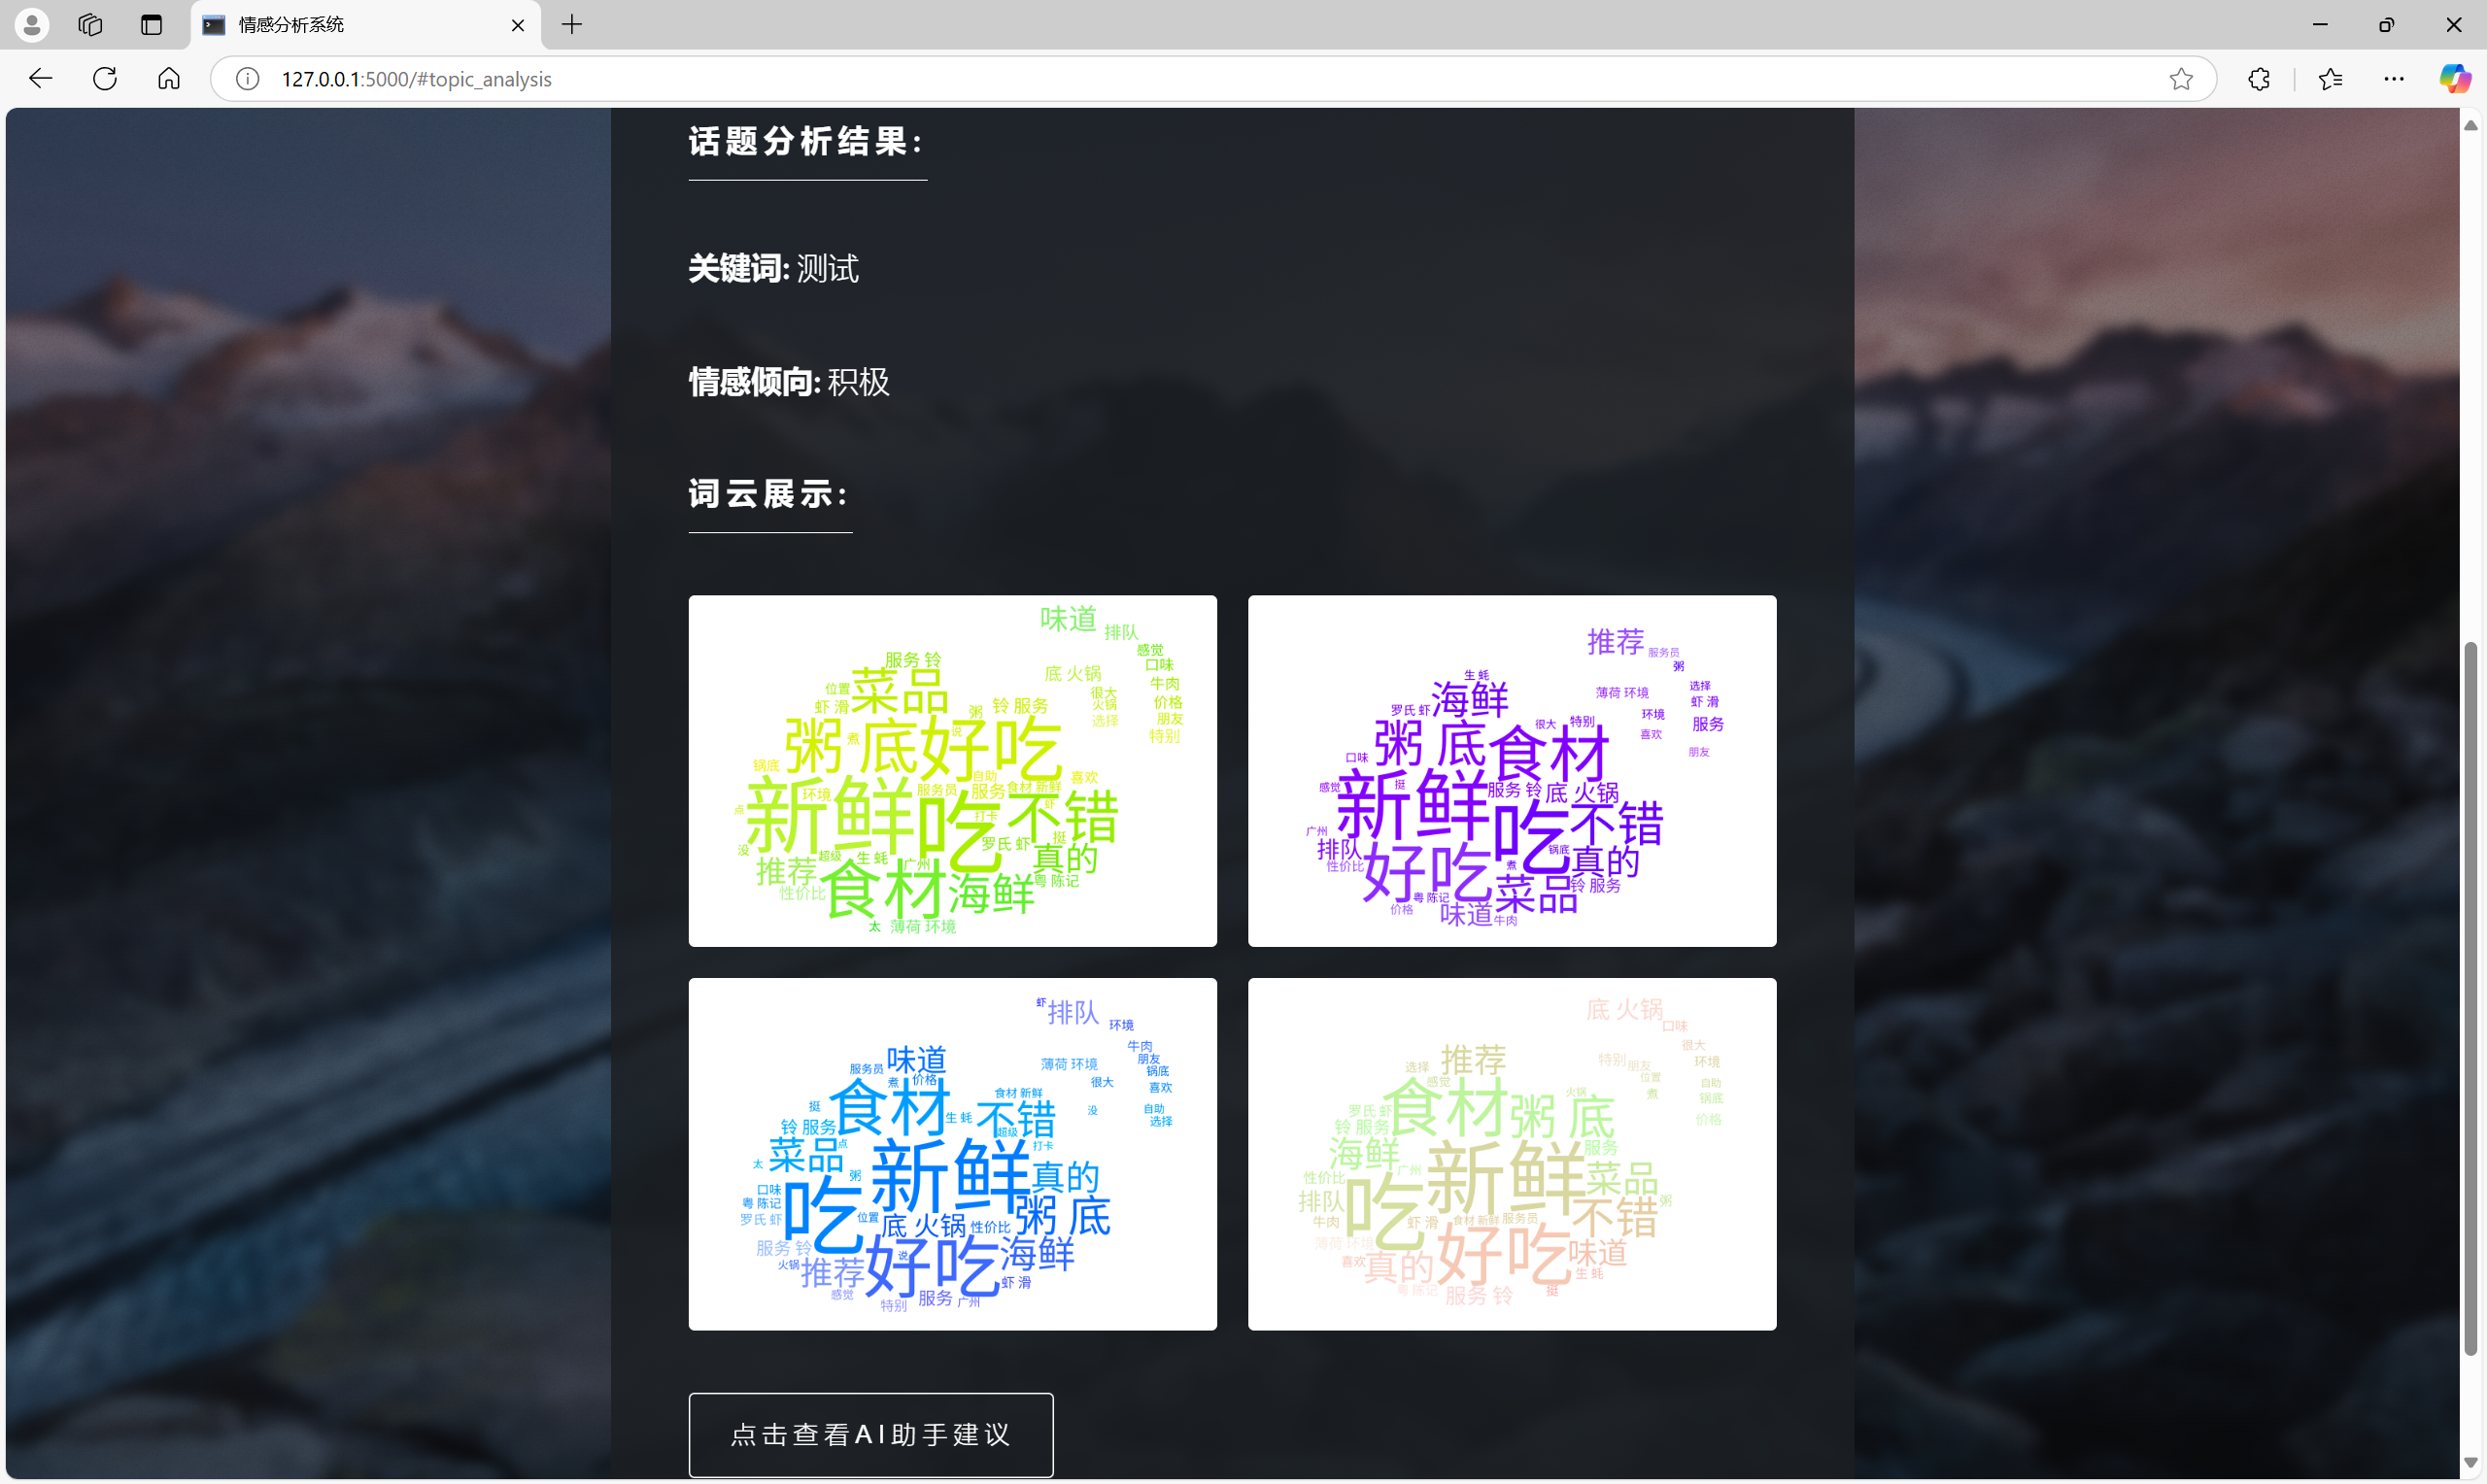
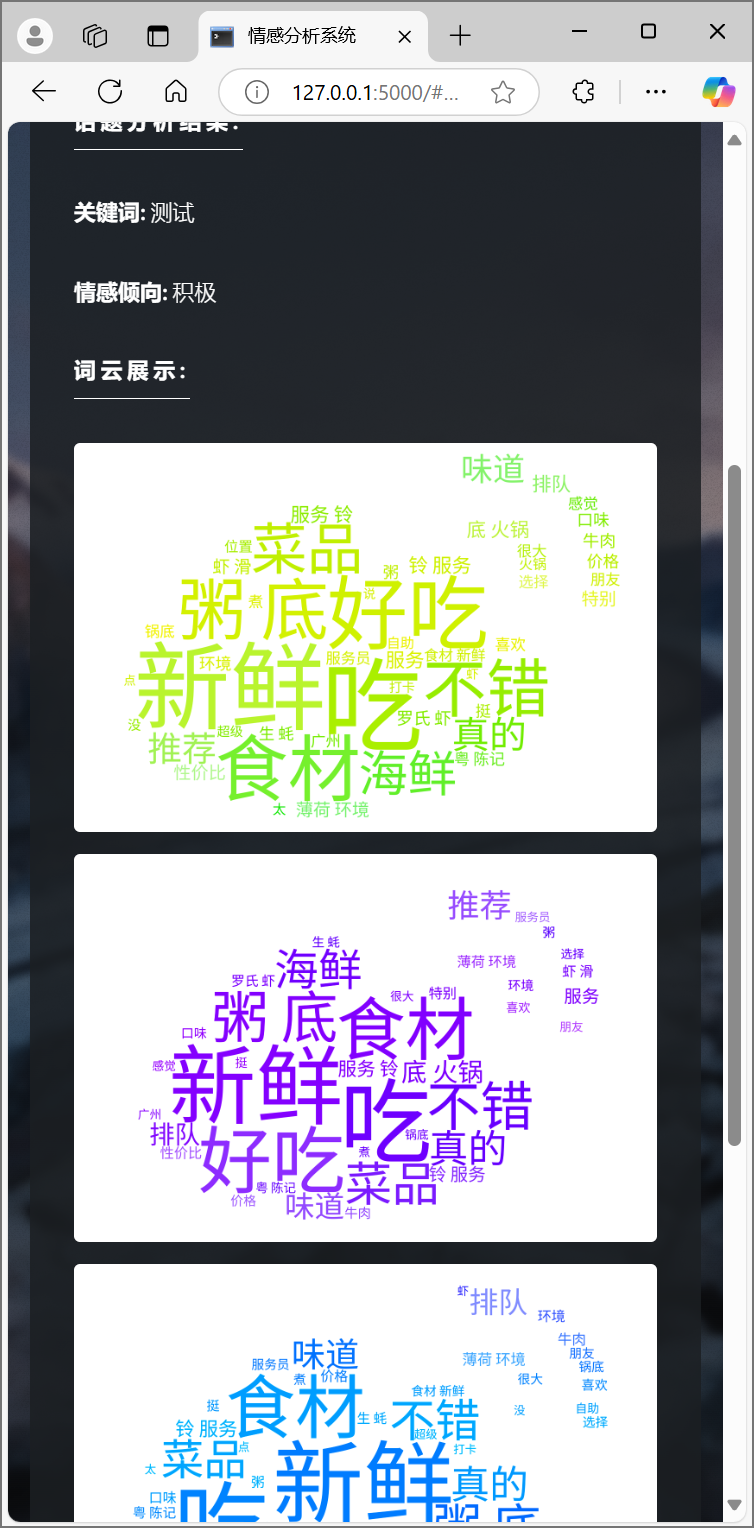
| 查看现有词云图在用户界面上的效果,对生成模块进行调整 | 梁恬 |
| 确定词云图在结果展示的样式 | 潘思言 |
| 使用 PyTorch 的 transformers 库来搭建一个BERT 模型进行情感分析 | 张颢严 |
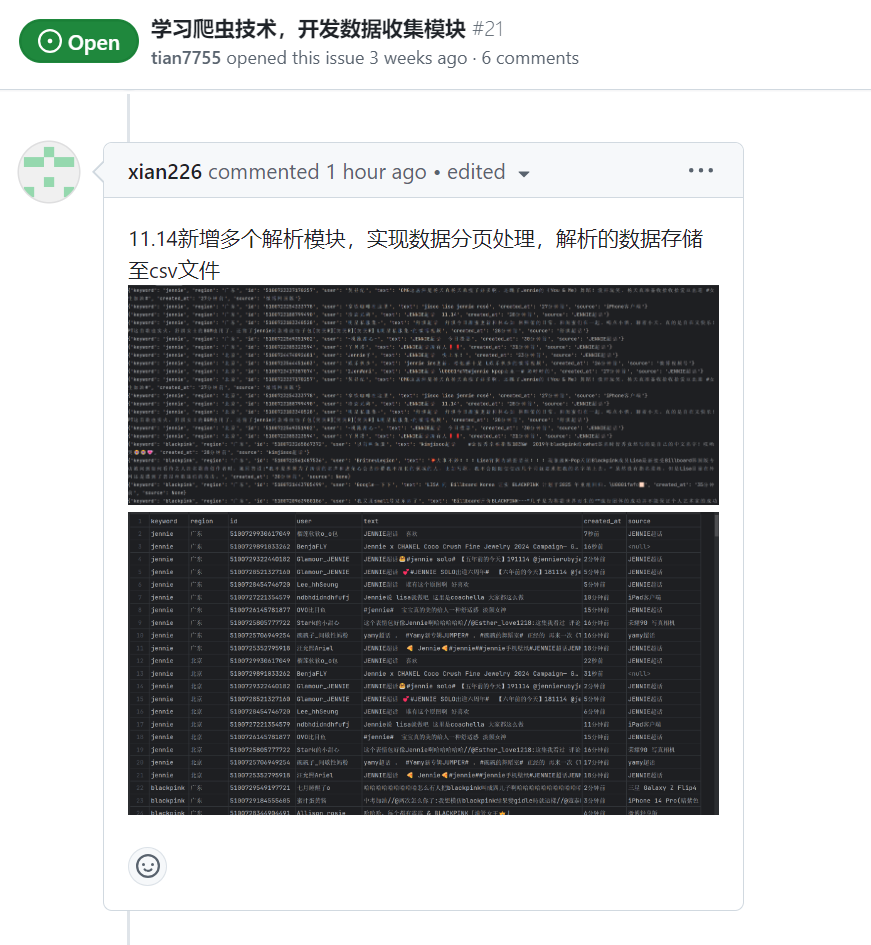
| 添加多个解析模块、csv数据存储 | 王睿娴 |
2、燃尽图
3、代码/文档签入记录
| 团队成员 | 代码/文档签入截图 | 对应的issues内容截图 | 对应的issues链接 |
|---|---|---|---|
| 梁恬 | 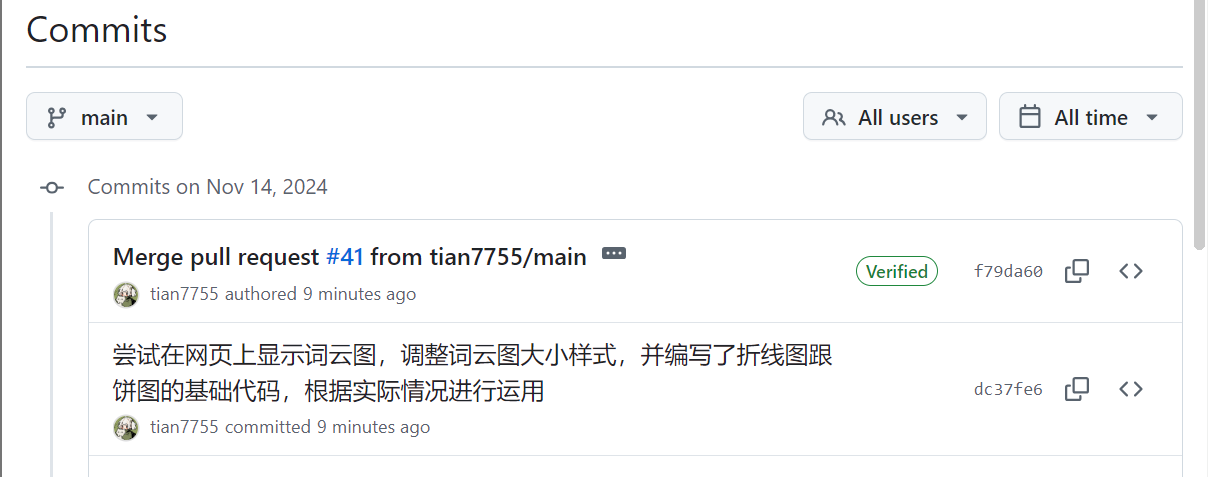 |
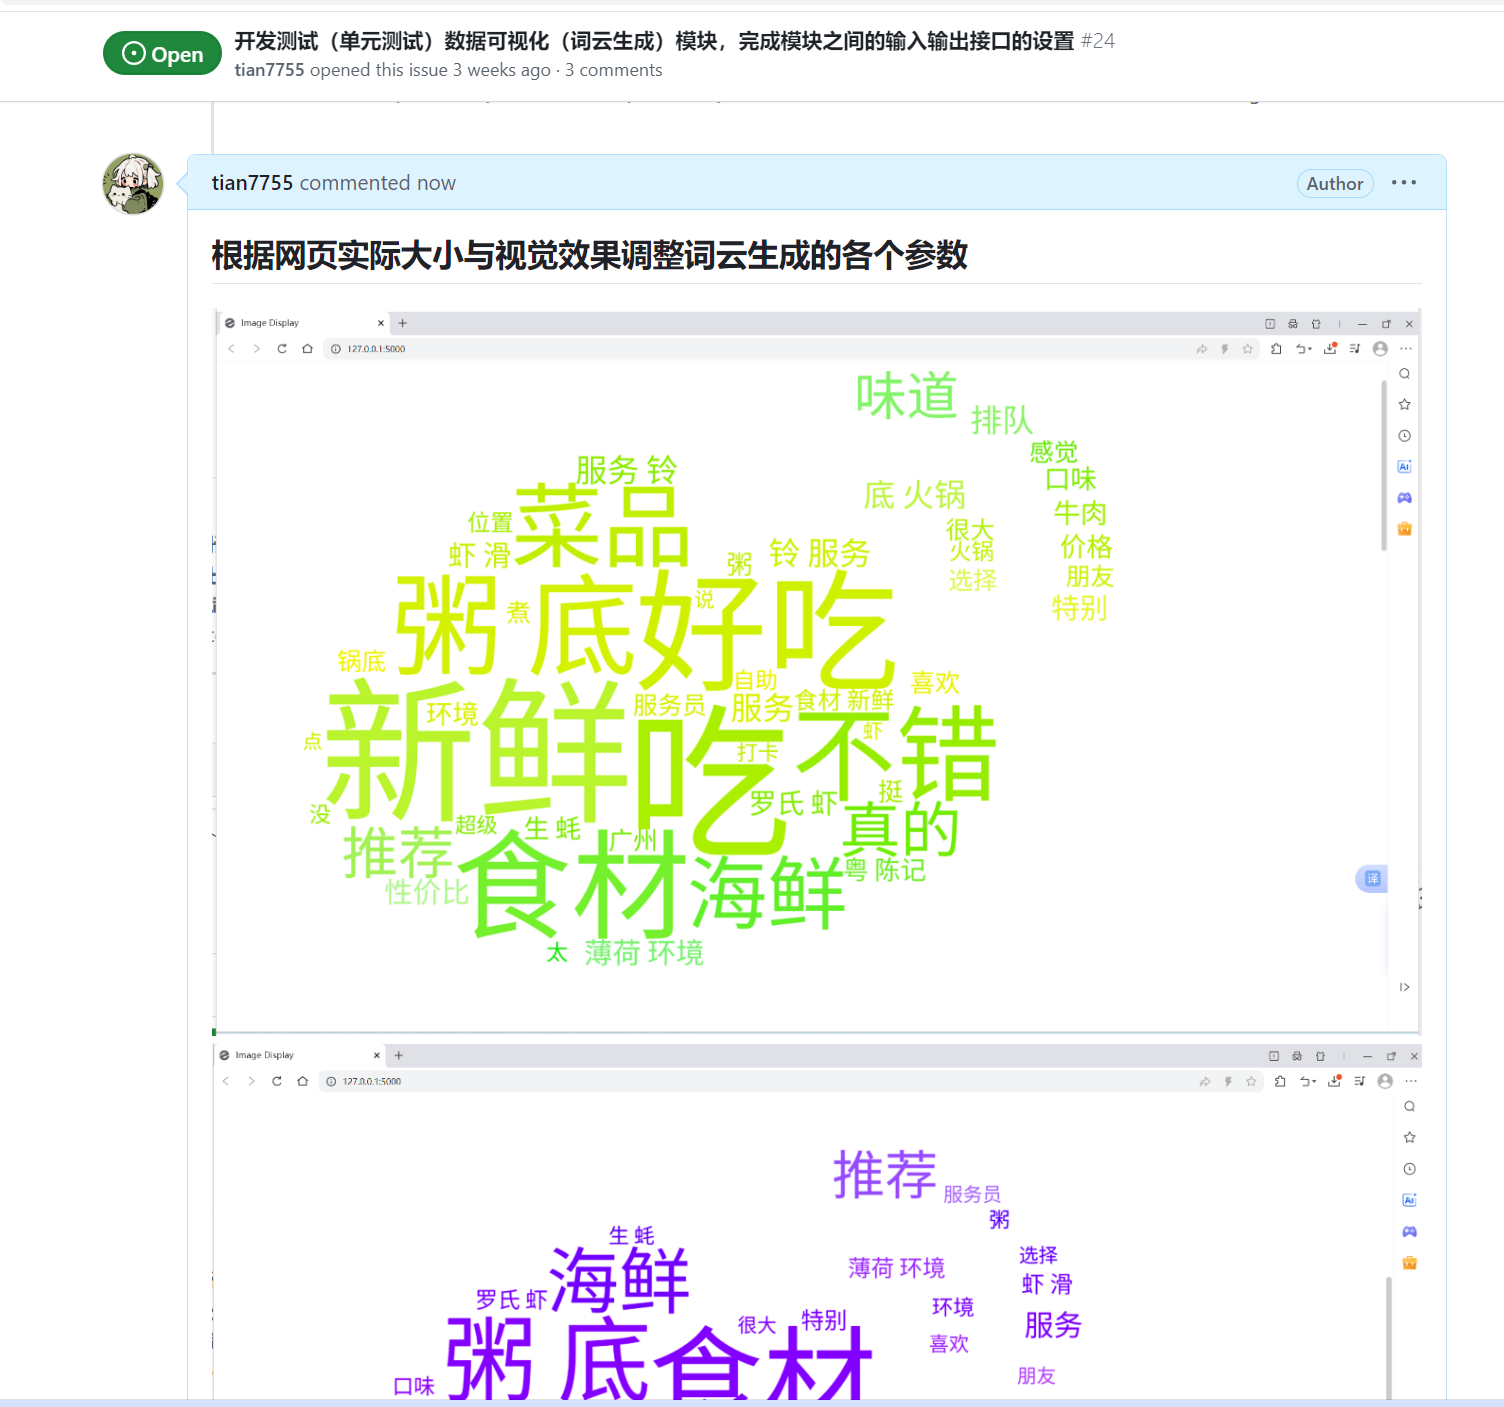 |
issues链接 |
| 潘思言 |  |
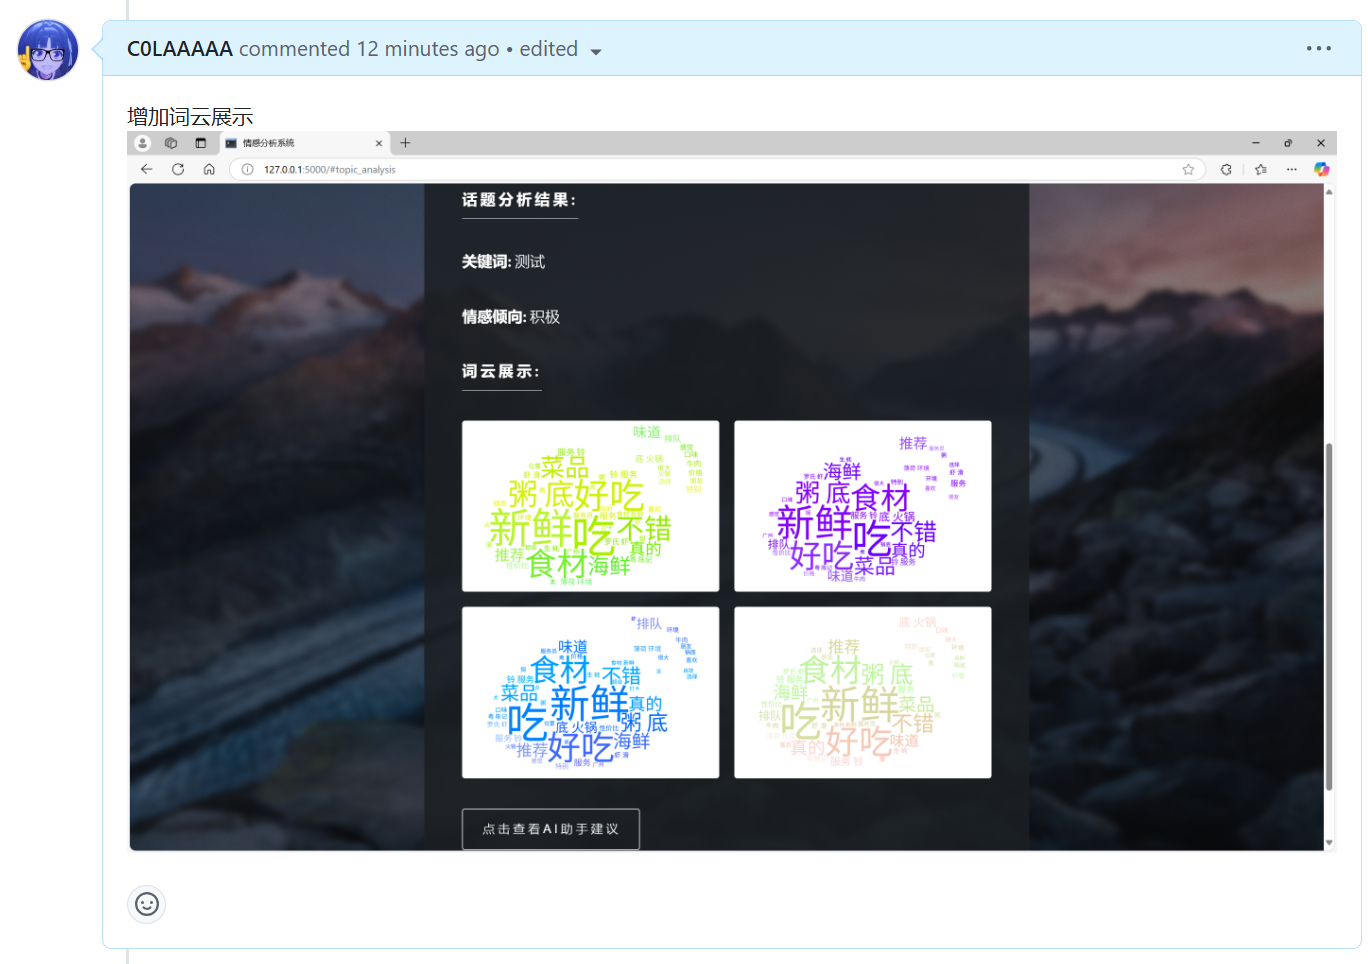 |
issues链接 |
| 张颢严 | 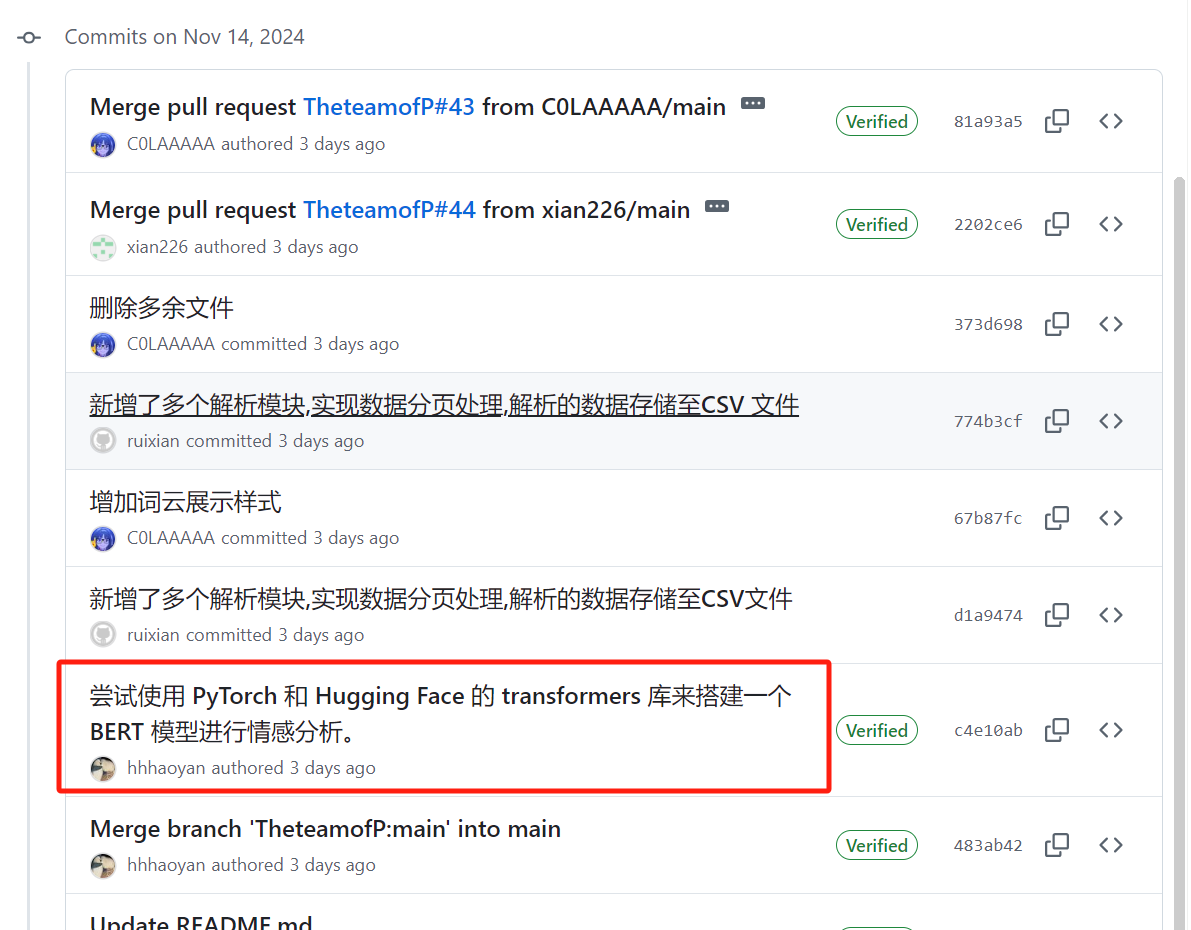 |
 |
issues链接 |
| 王睿娴 | 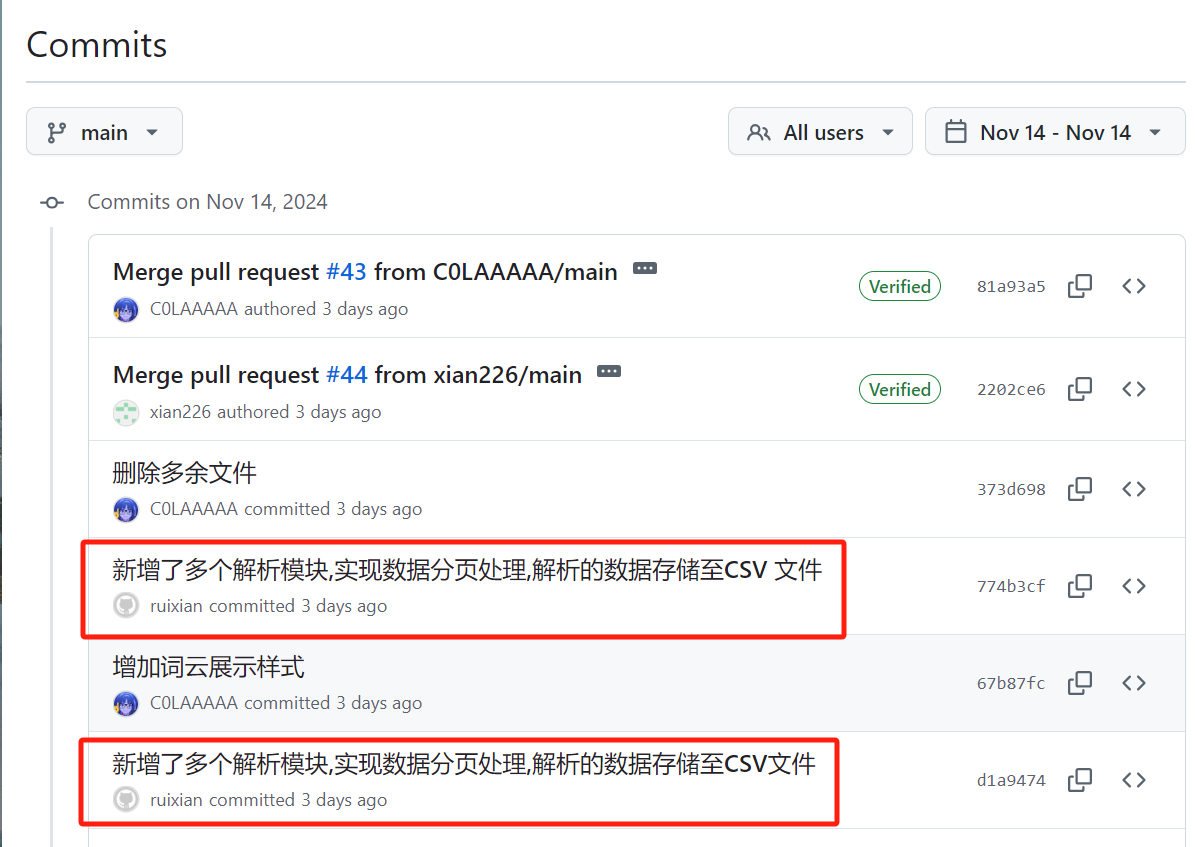 |
 |
issues链接 |
当日编码规范文档无更新
4、项目程序/模块的最新
4.1、最新模块的代码
点击查看数据可视化模块最新代码
wordclouds_generator.py
# 单个文件的词云图生成
def wordcloud_generator(sentiment, file_info, save_path, font_path, stopwords):
    try:
        # 读取文本数据与读取异常处理
        words = load_text_data(file_info['text'])
        if words is None:
            logger.error(f"Failed to load data file: {file_info['text']}")
            return
        # 中文分词
        words = cut_words(words)
        # 引进背景图片与图片颜色
        bg_image = imageio.imread((file_info['background']))
        bg_image_color = ImageColorGenerator(bg_image)
        # 创建,保存并优化词云图
        wordcloud = generate_wordcloud(words, font_path, bg_image, stopwords,
                                       bg_image_color)
        save_wordcloud(wordcloud, f'wordcloud_{sentiment}', dpi=150,
                       save_path=save_path)
        beautify_images(f'wordcloud_{sentiment}', save_path)
    except Exception as e:
        logger.error(f"Error generating {sentiment} wordcloud: {e}")

# 创建词云图
def generate_wordcloud(text, font_path, mask, stopwords, image_color):
    wc = WordCloud(
        font_path=font_path,
        background_color="white",       # 设置背景颜色
        color_func=image_color,         # 设置字体颜色,将上面模板图像生成的颜色传入词云
        max_words=250,                  # 最多显示的词数
        max_font_size=250,              # 字体最大值
        min_font_size=30,               # 字体最小值
        random_state=60,                # 设置随机种子以获得可重复的结果
        width=20, height=18,            # 设置图片的尺寸
        margin=1,                       # 设置词与词之间的距离
        stopwords=stopwords,
        mask=mask,
        prefer_horizontal=1.0,           # 词语横排显示的概率
        scale=3                          # 增加 scale 参数以提高输出图像的分辨率
    )
    return wc.generate(text)
line_chart_generator.py
import json
import matplotlib.pyplot as plt
from matplotlib.font_manager import FontProperties
from wordcloud_generator import beautify_images

def line_chart_generator():
    # 读取文件并解析每行的字典
    data = []
    with (open('../data/emotion_analysis_result.txt', 'r',
               encoding='utf-8-sig')
          as file):
        for line in file:
            data.append(json.loads(line))
    # 存储时间和对应的分数总和
    time_scores = {}
    # 累加分数
    for item in data:
        created_at = item['created_at']
        sentiment_score = item['sentiment_score']
        if created_at in time_scores:
            time_scores[created_at]['total'] += sentiment_score
            time_scores[created_at]['count'] += 1
        else:
            time_scores[created_at] = {'total': sentiment_score, 'count': 1}
    # 计算每个时间的平均分数
    average_scores = {time: scores['total'] / scores['count'] for time, scores
                      in time_scores.items()}
    # 准备绘图数据
    times = list(average_scores.keys())
    scores = list(average_scores.values())
    # 确保时间是有序的
    sorted_indices = sorted(range(len(times)), key=lambda k: times[k])
    times = [times[i] for i in sorted_indices]
    scores = [scores[i] for i in sorted_indices]
    # 创建折线图
    # 设置中文字体
    font_path = 'fonts/NotoSansSC-Regular.ttf'
    font = FontProperties(fname=font_path, size=14)
    plt.figure(figsize=(20, 18), dpi=300)
    plt.plot(times, scores, marker='o', label='平均情感得分')
    # 添加图例
    plt.legend(prop=font)
    # 添加标题和轴标签
    plt.title('情感得分时间曲线图', fontproperties=font)
    plt.xlabel('时间', fontproperties=font)
    plt.ylabel('平均情感得分', fontproperties=font)
    # 显示网格
    plt.grid(True)
    plt.tight_layout(pad=0)
    # 保存
    plt.savefig("../output/line_chart.png", dpi=300)
    beautify_images('line_chart', '../output/')
if __name__ == "__main__":
    line_chart_generator()
pie_chart_generator.py
import json
import matplotlib.pyplot as plt
from matplotlib.font_manager import FontProperties
from wordcloud_generator import beautify_images

def pie_chart_generator():
    # 读取文件并解析每行的字典
    data = []
    with (open('../data/emotion_analysis_result.txt', 'r',
               encoding='utf-8-sig')
          as file):
        for line in file:
            data.append(json.loads(line))
    # 统计情感极性的数量
    sentiment_counts = {'正面': 0, '负面': 0, '中性': 0}
    for item in data:
        sentiment = item['sentiment']
        if sentiment in sentiment_counts:
            sentiment_counts[sentiment] += 1
    # 准备绘图数据
    labels = list(sentiment_counts.keys())
    sizes = list(sentiment_counts.values())
    # 为每种情感选择颜色
    colors = ['gold', 'lightcoral', 'lightskyblue']
    # 创建折线图
    # 设置中文字体
    font_path = 'fonts/NotoSansSC-Regular.ttf'
    font = FontProperties(fname=font_path, size=14)
    plt.figure(figsize=(20, 18), dpi=300)
    plt.pie(sizes, labels=labels, colors=colors, autopct='%1.1f%%',
            startangle=140)
    # 添加标题和轴标签
    plt.title('情感极性分布', fontproperties=font)
    plt.axis('equal')  # 使饼图为圆形
    # 保存
    plt.savefig("../output/line_chart.png", dpi=300)
    beautify_images('line_chart', '../output/')
if __name__ == "__main__":
    pie_chart_generator()
点击查看用户交互模块最新代码
.image-grid {
    display: grid;
    grid-template-columns: repeat(2, 1fr); /* 两列布局 */
    gap: 1rem;
    margin: 2rem 0;
}
.image-grid .image {
    position: relative;
    overflow: hidden;
    border-radius: 4px;
}
.image-grid .image img {
    display: block;
    width: 100%;
    border-radius: 4px;
}

/* 移动端优化 */
@media screen and (max-width: 736px) {
    .image-grid {
       grid-template-columns: 1fr;
    }
}
@media screen and (max-width: 480px) {
    .image-grid {
       gap: 0.5rem;
       margin: 1.5rem 0;
    }
}
index.html
 // 插入词云图片
                                    resultHTML +=  '<h3 class="major">词云展示:</h3>';
                                    resultHTML += '<div class="image-grid">';
                                    resultHTML += '<div class="image"><img src="{{ url_for("static", filename="wordclouds/wordcloud_all.png") }}" alt="词云图1" class="wordcloud"></div>';
                                    resultHTML += '<div class="image"><img src="{{ url_for("static", filename="wordclouds/wordcloud_negative.png") }}" alt="词云图2" class="wordcloud"></div>';
                                    resultHTML += '<div class="image"><img src="{{ url_for("static", filename="wordclouds/wordcloud_neutral.png") }}" alt="词云图3" class="wordcloud"></div>';
                                    resultHTML += '<div class="image"><img src="{{ url_for("static", filename="wordclouds/wordcloud_positive.png") }}" alt="词云图4" class="wordcloud"></div>';
                                    resultHTML += '</div>';
点击查看数据收集模块最新代码
def parse(self, response):
"""按天解析"""
keyword = response.meta.get('keyword')
region = response.meta.get('region', '全部')
# 解析微博数据
for weibo in self.parse_weibo(response):
yield weibo
# 检查是否有下一页
next_url = response.xpath('//a[@class="next"]/@href').get()
if next_url:
next_url = response.urljoin(next_url)
yield scrapy.Request(url=next_url, callback=self.parse, meta={'keyword': keyword, 'region': region})
else:
# 页面微博数量是否超过阈值,如果超过则进一步细分按天处理
page_count = len(response.xpath('//ul[@class="s-scroll"]/li'))
if page_count >= self.further_threshold:
start_date = datetime.strptime(self.settings.get('START_DATE'), '%Y-%m-%d')
end_date = datetime.strptime(self.settings.get('END_DATE'), '%Y-%m-%d')
current_date = start_date
while current_date <= end_date:
next_day = current_date + timedelta(days=1)
start_str = current_date.strftime('%Y-%m-%d')
end_str = next_day.strftime('%Y-%m-%d')
url = f"{self.base_url}{keyword}×cope=custom:{start_str}:{end_str}"
yield scrapy.Request(url=url, callback=self.parse_by_day,
meta={'keyword': keyword, 'region': region})
current_date = next_day
def parse_by_day(self, response):
"""按天进一步细分,处理分页及按小时细分"""
keyword = response.meta.get('keyword')
date = response.meta.get('date')
region = response.meta.get('region', '全部')
# 提取当前页面的微博数据
for weibo in self.parse_weibo(response):
yield weibo
# 检查是否有下一页
next_url = response.xpath('//a[@class="next"]/@href').get()
if next_url:
next_url = response.urljoin(next_url)
yield scrapy.Request(
url=next_url,
callback=self.parse_by_day,
meta={'keyword': keyword, 'date': date, 'region': region}
)
else:
# 如果没有下一页,则按小时细分请求
start_date = datetime.strptime(date, '%Y-%m-%d')
for hour in range(24):
start_time = start_date.replace(hour=hour).strftime('%Y-%m-%d-%H')
end_time = start_date.replace(hour=hour + 1).strftime('%Y-%m-%d-%H')
url = f"{response.meta['base_url']}{self.weibo_type}{self.contain_type}×cope=custom:{start_time}:{end_time}&page=1"
yield scrapy.Request(
url=url,
callback=self.parse_by_hour,
meta={'keyword': keyword, 'start_time': start_time, 'end_time': end_time, 'region': region}
)
def parse_by_hour(self, response):
"""以小时为单位解析微博数据"""
keyword = response.meta.get('keyword')
start_time = response.meta.get('start_time')
end_time = response.meta.get('end_time')
region = response.meta.get('region', '全部')
#依次解析微博数据
for weibo in self.parse_weibo(response):
yield weibo
#分页处理
next_url = response.xpath('//a[@class="next"]/@href').get()
if next_url:
next_url = response.urljoin(next_url)
yield scrapy.Request(url=next_url, callback=self.parse_by_hour, meta={'keyword': keyword, 'region': region})
def parse_by_hour_province(self, response):
"""按小时和省级地区进行微博数据抓取与分页解析"""
keyword = response.meta.get('keyword')
start_time = response.meta.get('start_time')
end_time = response.meta.get('end_time')
province = response.meta.get('province')
for weibo in self.parse_weibo(response):
yield weibo
next_url = response.xpath('//a[@class="next"]/@href').get()
if next_url:
next_url = response.urljoin(next_url)
yield scrapy.Request(url=next_url, callback=self.parse_by_hour_province,
meta={'keyword': keyword, 'province': province})
点击查看情感分析模块最新代码
import pandas as pd
from sklearn.feature_extraction.text import CountVectorizer
from sklearn.naive_bayes import MultinomialNB
from sklearn import metrics
from utils import load_corpus, stopwords, processing

# 设置文件路径
TRAIN_PATH = "./data/weibo2018/train.txt"
TEST_PATH = "./data/weibo2018/test.txt"
PREDICT_PATH = r"D:\PythonProject\Emotion-Analysis-Project-main\Emotion-Analysis\model\labeled_train_comments.csv"

if __name__ == "__main__":
    # 加载训练集和测试集
    train_data = load_corpus(TRAIN_PATH)
    test_data = load_corpus(TEST_PATH)

    # 将训练集和测试集转换为 DataFrame
    df_train = pd.DataFrame(train_data, columns=["words", "label"])
    df_test = pd.DataFrame(test_data, columns=["words", "label"])

    # 查看训练集数据
    print("训练集示例:")
    print(df_train.head())

    # 使用 CountVectorizer 对文本进行向量化
    vectorizer = CountVectorizer(token_pattern=r'\[?\w+\]?', stop_words=stopwords)

    # 转换训练集文本为特征向量
    X_train = vectorizer.fit_transform(df_train["words"])
    y_train = df_train["label"]

    # 转换测试集文本为特征向量
    X_test = vectorizer.transform(df_test["words"])
    y_test = df_test["label"]

    # 使用 Multinomial Naive Bayes 训练模型
    clf = MultinomialNB()
    clf.fit(X_train, y_train)

    # 使用训练好的模型进行预测
    y_pred = clf.predict(X_test)

    # 输出测试集效果评估
    print(metrics.classification_report(y_test, y_pred))
    print("准确率:", metrics.accuracy_score(y_test, y_pred))

    # 加载 CSV 文件中的测试文本
    predict_df = pd.read_csv(PREDICT_PATH)

    # 确保测试文本列存在并进行预处理
    if "text" not in predict_df.columns:
        raise ValueError("CSV 文件中必须包含 'text' 列")

    predict_texts = predict_df["text"].apply(processing).tolist()

    # 转换测试文本为特征向量
    vec = vectorizer.transform(predict_texts)

    # 预测并输出结果
    predictions = clf.predict(vec)
    predict_df["prediction"] = predictions

    # 保存预测结果到 CSV 文件
    output_path = "./data/weibo2018/predicted_results.csv"
    predict_df.to_csv(output_path, index=False, encoding="utf-8")
    print(f"预测结果已保存到: {output_path}")
4.2、各更新模块/系统的运行截图
用户交互模块
数据可视化模块
数据收集模块
情感分析模块
5、每人每日总结
| 团队成员 | 每日总结 |
|---|---|
| 梁恬 | 由于负责模块的开发测试基本完成,今天只是对模块进行调整和拓展。 |
| 潘思言 | 在使用爬虫的分析模块增加了词云展示样式,仍需优化 |
| 张颢严 | 今天完成了情感分析程序的初步编写,利用 bert和snownlp 对微博文本进行了情感得分计算和关键词提取,能够对数据集中的评论进行情感分类。遇到的主要问题是部分文本存在噪声,需要后续改进数据预处理流程。下一步计划优化分类标准并提升程序效率 |
| 王睿娴 | 通过今天的工作,微博爬虫已初步具备了多维度、多时间段的精准数据抓取能力,为后续的分析奠定了基础。明天还需要优化 |


