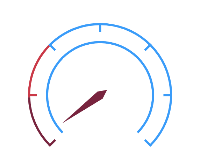
仪表盘
目前一个图表项目需要用echarts画一个简易仪表盘,找了半天,没有找到想要的,经过修改最后画了出来

代码如下:
1 2 3 4 5 6 7 8 9 10 11 12 13 14 15 16 17 18 19 20 21 22 23 24 25 26 27 28 29 30 31 32 33 34 35 36 37 38 39 40 41 42 43 44 45 46 47 48 49 50 51 52 53 54 55 56 57 58 59 60 61 62 63 64 65 66 67 68 69 70 71 72 73 74 75 76 77 78 79 80 81 82 83 84 85 86 87 88 89 90 91 92 93 94 95 | //仪表板 option = { series: [ { name: '1刻度', type: 'gauge', // radius: '45%', // center: ['50%', '50%'], // startAngle: 212, // endAngle: -32, axisLine: { lineStyle: { width:1, color:[[1,'#3a9cf9']] }, }, splitLine: { show: false, }, axisLabel: { show:false }, axisTick:{ show:false }, detail:{ show:false }, pointer:{ show: false } }, { name: '2刻度', type: 'gauge',//仪表盘 radius: '100%',//仪表盘半径 center: ['50%', '50%'],//仪表盘位置 splitNumber: 6, // startAngle:208,//起始角度 // endAngle: -28,//结束角度 // data: [{value: 10, name: ''}], axisLine: { lineStyle: {//仪表盘轴线相关配置。 color: [ //表盘颜色 [ 0.16, "#78243E" ],//0-50%处的颜色 [ 0.33, "#ca3947" ],//51%-70%处的颜色 [ 0.5, "#3a9cf9" ],//70%-90%处的颜色 [ 0.8,"#3a9cf9" ],//90%-100%处的颜色 [ 0.9,"#3a9cf9" ],//90%-100%处的颜色 [ 1,"#3a9cf9" ]//90%-100%处的颜色 ], width : 1//表盘宽度 } }, splitLine: {//分隔线样式相关 length: 4,//分割线的长度 lineStyle: { width:1, color:'auto' } }, axisLabel: {//大刻度标签。 show: false, }, axisTick:{//小刻度相关 show:false }, detail: {//仪表盘详情数据相关 show: false, textStyle: { color: '#5bdbff', fontSize:8, offsetCenter: [0,'80%'] } }, itemStyle:{//指针样式 normal: { lineStyle: { shadowColor : 'rgba(0,0,0,0.4)', } } }, pointer:{//指针长度与宽度 width: 2, length: '66%', color : 'auto' }, data: [{ value: 3.1 }] } ] }; var chart= echarts.init(document.getElementById('option')); chart.setOption(InOptionCH4, true); |


【推荐】国内首个AI IDE,深度理解中文开发场景,立即下载体验Trae
【推荐】编程新体验,更懂你的AI,立即体验豆包MarsCode编程助手
【推荐】抖音旗下AI助手豆包,你的智能百科全书,全免费不限次数
【推荐】轻量又高性能的 SSH 工具 IShell:AI 加持,快人一步