【调试】ftrace(二)新增跟踪点
内核的各个子系统已经有大量的跟踪点,如果这些跟踪点无法满足工作中的需求,可以自己手动添加跟踪点。
添加跟踪点有两种方式,一种是仿照events/目录下的跟踪点,使用TRACE_EVENT() 宏添加。另一种是参考内核目录samples/trace_events添加。本文对这两种方式分别进行介绍。
使用 TRACE_EVENT 定义 tracepoint
我们仿照events/timer/timer_start,添加一个timer_stat的跟踪点,获取start_pid和slack参数。
首先,需要在include/trace/events/timer.h头文件种添加名为timer_stat的跟踪点。
/**
 * timer_stat - ftrace interface timer_stat
 * @timer:	pointer to struct timer_list
 */
TRACE_EVENT(timer_stat,

	TP_PROTO(struct timer_list *timer),

	TP_ARGS(timer),

	TP_STRUCT__entry(
		__field( void *,	timer		)
		__field( int,		start_pid		)
		__field( int,		slack)
	),

	TP_fast_assign(
		__entry->timer			= timer;
		__entry->start_pid		= timer->start_pid;
		__entry->slack			= timer->slack;
	),

	TP_printk("ftrace interface timer_stat:timer=%p pid=%d slack=%d\n",
		  __entry->timer,__entry->start_pid,__entry->slack)
);
TRACE_EVENT()宏如下
#define TRACE_EVENT(name, proto, args, struct, assign, print)	\
	DEFINE_TRACE(name)
- name:表示跟踪点的名字,如上面的timer_stat。
- proto:表示跟踪点调用的入参的原型,比如
timer类型为struct timer_list *。 - args:表示参数。
- struct:定义跟踪器内部使用的
__entry数据结构。 - assign:把参数复制到
__entry数据结构中。 - print:定义输出的格式。
接着在kernel/kernel/time/timer.c debug_activate()添加trace_timer_stat()。
static inline void
debug_activate(struct timer_list *timer, unsigned long expires)
{
        debug_timer_activate(timer);
        trace_timer_start(timer, expires, timer->flags);
        trace_timer_stat(timer);
}
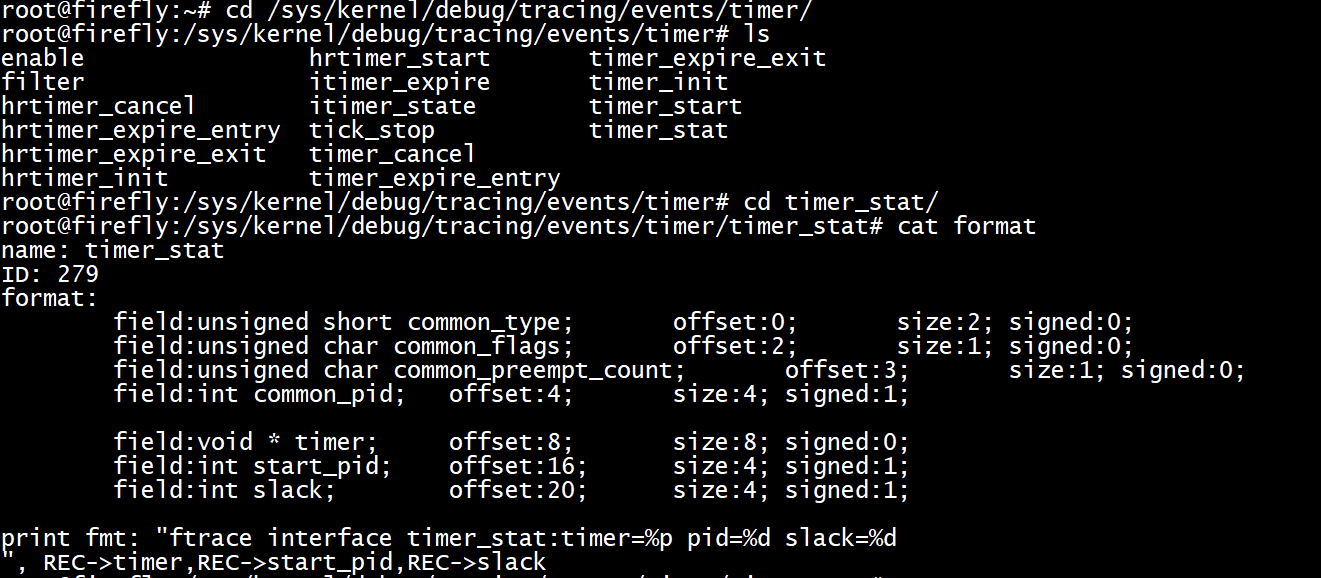
重新编译内核后,烧写到设备中,即可看到sys节点已经有了新增的跟踪点。
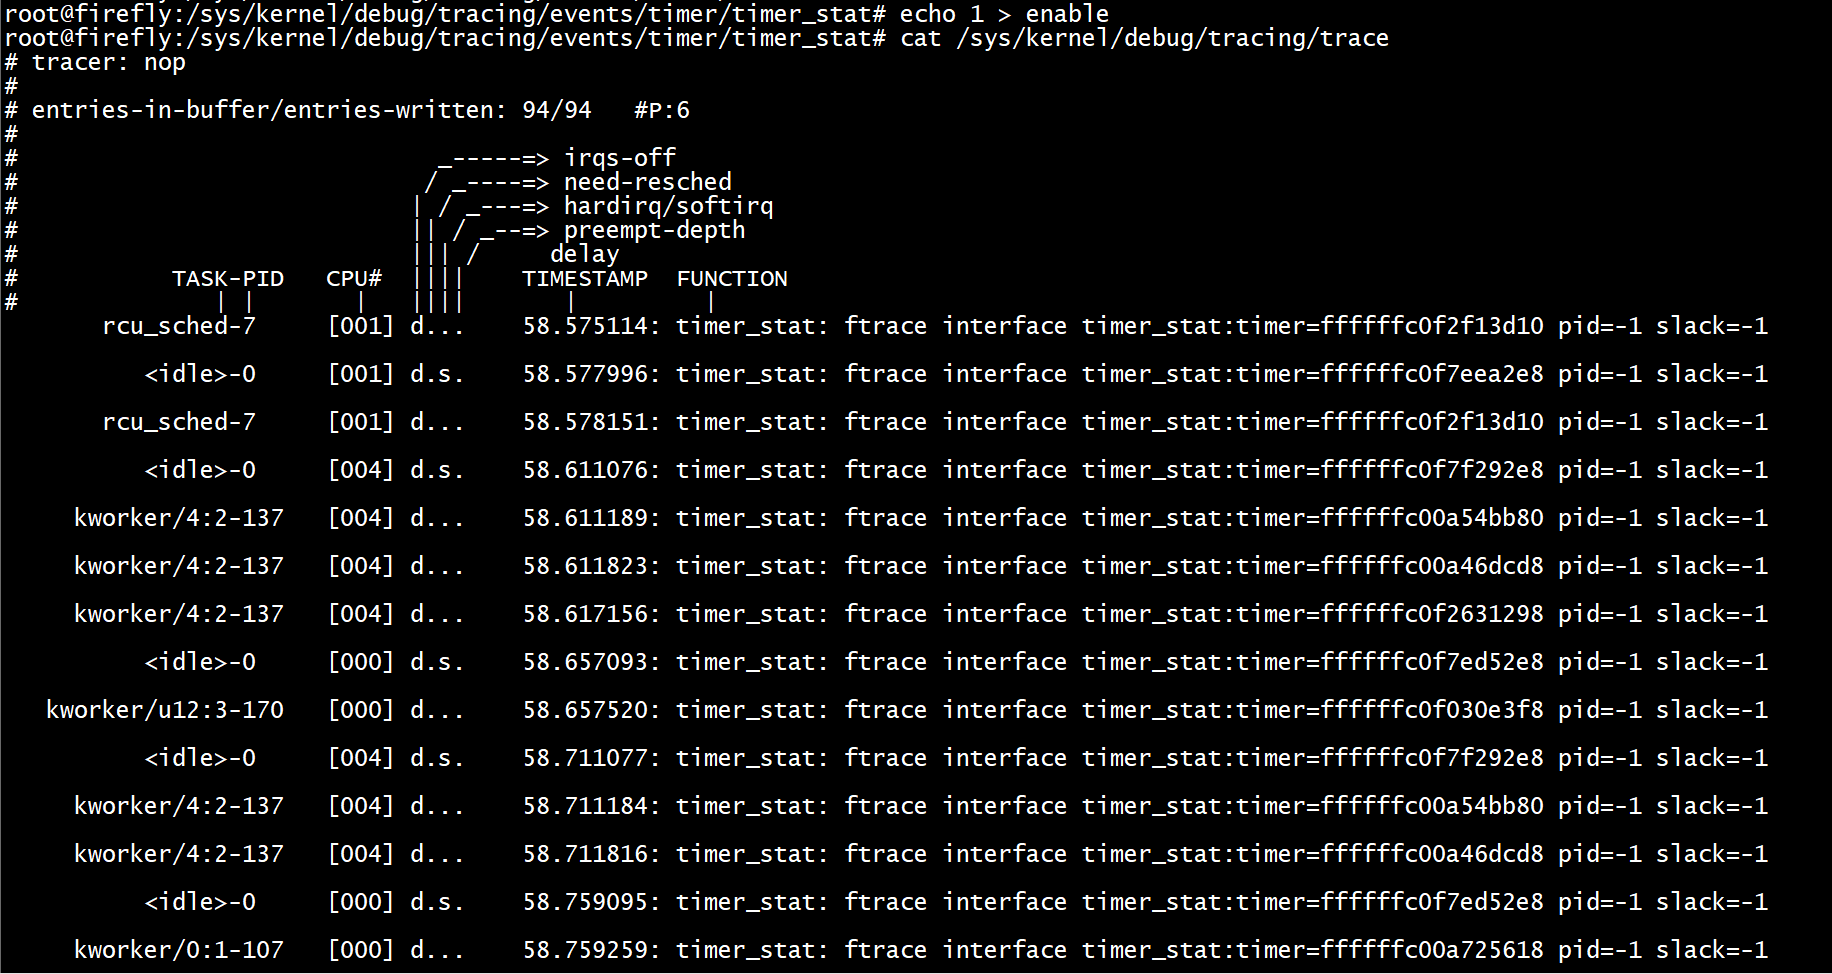
使能跟踪点后,查看trace点的输出。
编译为独立的ko文件
内核还提供了一个跟踪点的例子,在samples/trace_events 目录下。
trace_event_init()创建内核线程一个名为event-sample内核线程。
static int __init trace_event_init(void)
{
	simple_tsk = kthread_run(simple_thread, NULL, "event-sample");
	if (IS_ERR(simple_tsk))
		return -1;

	return 0;
}
kthread_should_stop()用于创建的线程检查结束标志,并决定是否退出。
static int simple_thread(void *arg)
{
	int cnt = 0;

	while (!kthread_should_stop())
		simple_thread_func(cnt++);

	return 0;
}
set_current_state() 来设置进程的状态,设置为TASK_INTERRUPTIBLE表示是可以被信号和wake_up()唤醒的,当信号到来时,进程会被设置为可运行。
schedule_timeout()将当前task调度出cpu,重新调度间隔为HZ。接着trace_开头的函数就会依次打印跟踪点的信息。
static void simple_thread_func(int cnt)
{
	int array[6];
	int len = cnt % 5;
	int i;

	set_current_state(TASK_INTERRUPTIBLE);
	schedule_timeout(HZ);

	for (i = 0; i < len; i++)
		array[i] = i + 1;
	array[i] = 0;

	/* Silly tracepoints */
	trace_foo_bar("hello", cnt, array, random_strings[len],
		      tsk_cpus_allowed(current));

	trace_foo_with_template_simple("HELLO", cnt);

	trace_foo_bar_with_cond("Some times print", cnt);

	trace_foo_with_template_cond("prints other times", cnt);

	trace_foo_with_template_print("I have to be different", cnt);
}
trace_foo_with_template_simple跟踪点的实现方式也是使用的TRACE_EVENT ()宏,这里不再赘述。
最后将文件编译为ko拷贝到设备上insmod后,即可看到sys目录下已经有新增的节点。
cd	/home/zhongyi/code/rk3399_linux_release_v2.5.1_20210301/kernel/samples/trace_events
make -C /home/zhongyi/code/rk3399_linux_release_v2.5.1_20210301/kernel/ M=$(pwd) modules
root@firefly:/sys/kernel/debug/tracing# cat available_events | grep sample
sample-trace:foo_bar
sample-trace:foo_bar_with_cond
race:foo_bar_with_fn
sample-trace:foo_with_template_simple
sample-trace:foo_with_template_cond
sample-trace:foo_with_template_fn
sample-trace:foo_with_template_print
power:pstate_sample
root@firefly:/sys/kernel/debug/tracing# cd events/sample-trace/
root@firefly:/sys/kernel/debug/tracing/events/sample-trace# ls
enable foo_bar_with_cond foo_with_template_fn
filter foo_bar_with_fn foo_with_template_print
foo_bar foo_with_template_cond foo_with_templ_simple
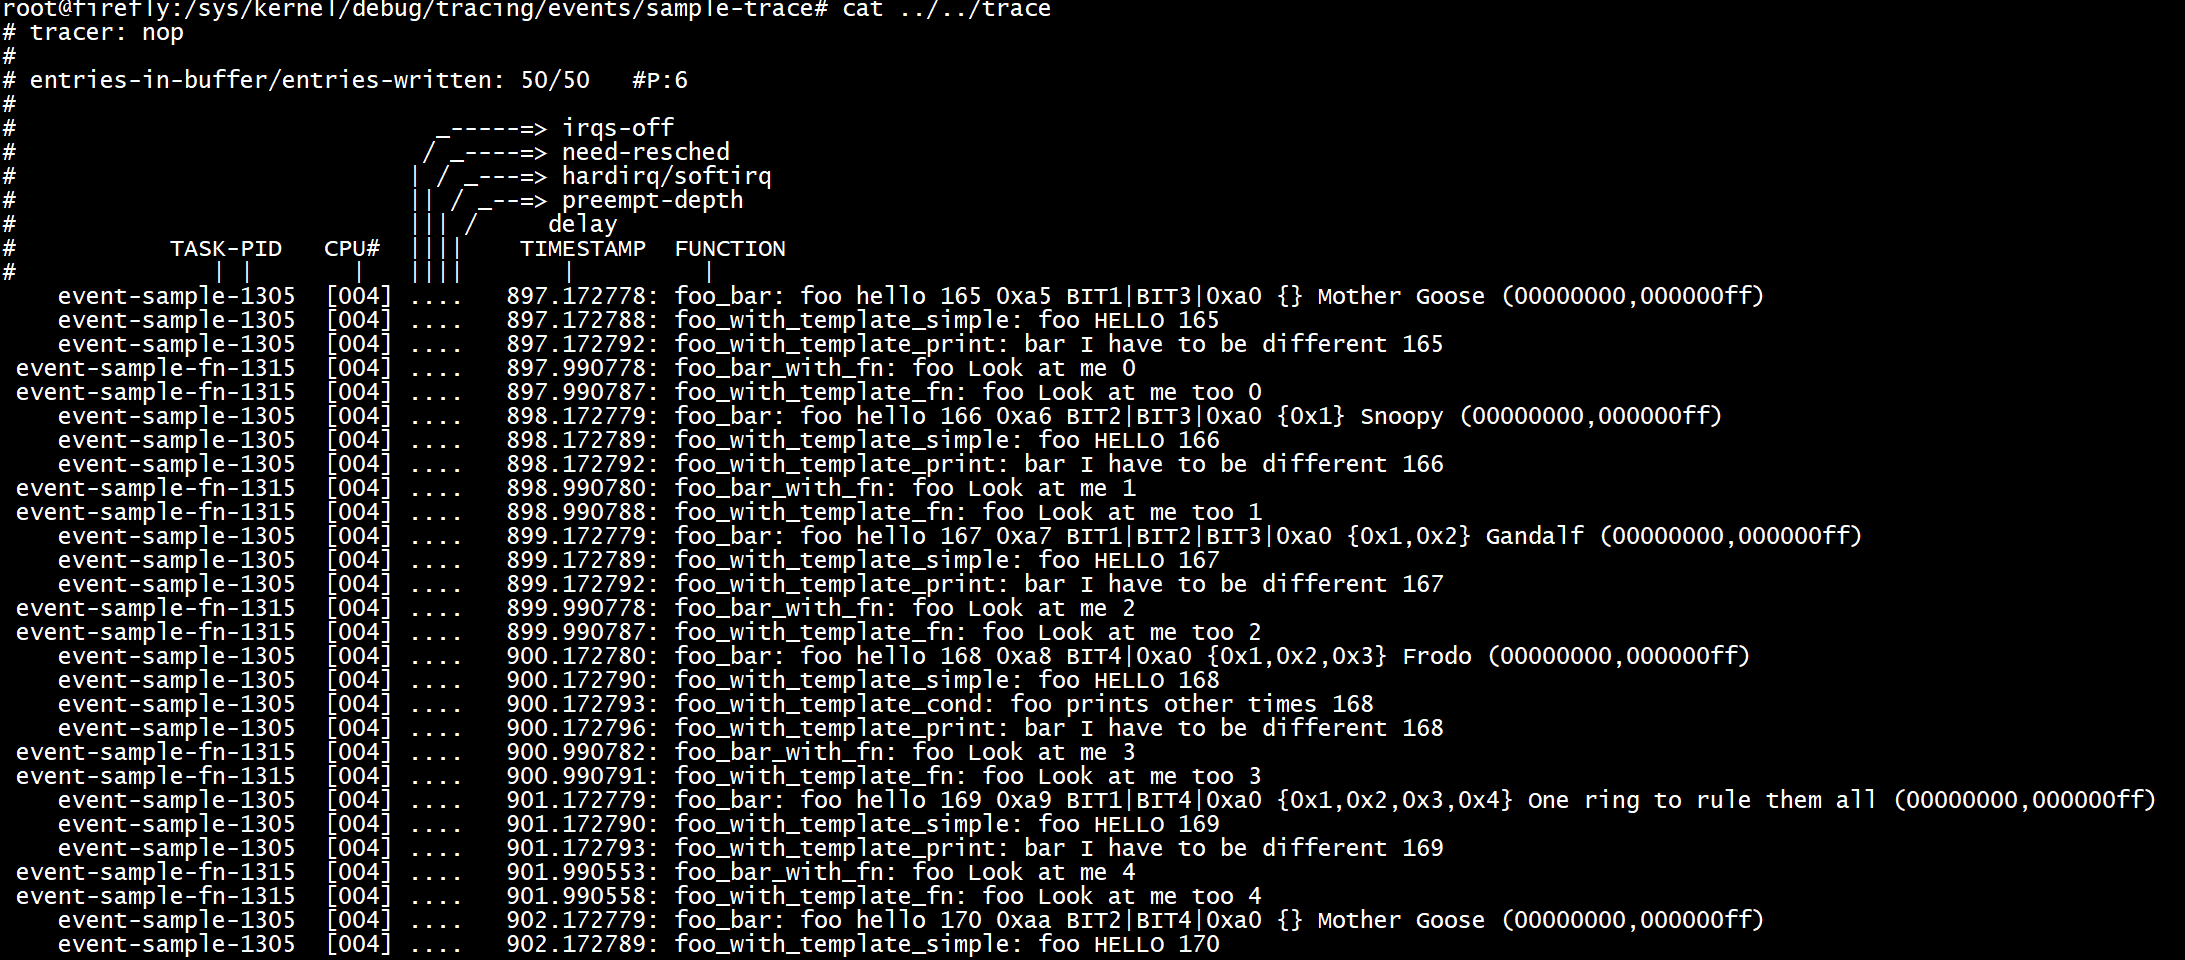
root@firefly:/sys/kernel/debug/tracing/events/sample-trace# echo 1 > enable
root@firefly:/sys/kernel/debug/tracing/events/sample-trace# cat /sys/kernel/debug/tracing/trace
TRACE_EVENT_CONDITION()
在某些情况下,跟踪点只有在某个条件发生时才会被调用,类似于
if (cond)
	trace_foo();
TRACE_EVENT_CONDITION()宏就是这个作用,它和TRACE_EVENT()相比只是在参数中多加了一个cond条件。TP_CONDITION()会对条件做个判断。
TRACE_EVENT(name, proto, args, struct, assign, printk)
TRACE_EVENT_CONDITION(name, proto, args, cond, struct, assign, printk)
详细使用方法可以参考trace-events-sample.h。
TRACE_EVENT_FN()
TRACE_EVENT_FN()是在跟踪点使能前和使能后分别打印一些信息。相比于TRACE_EVENT(),TRACE_EVENT_FN()多了两个参数reg和unreg,
TRACE_EVENT(name, proto, args, struct, assign, printk)
TRACE_EVENT_FN( name, proto, args, struct, assign, printk, reg, unreg)
reg 和unreg原型为
void reg(void)
reg函数在跟踪点使能前打印,unreg函数在跟踪点使能后打印。reg 和unreg可以根据实际情况置其中一个为NULL,也可以全部置为NULL。
详细使用方法可以参考trace-events-sample.h。
本文参考
samples/trace_events

 浙公网安备 33010602011771号