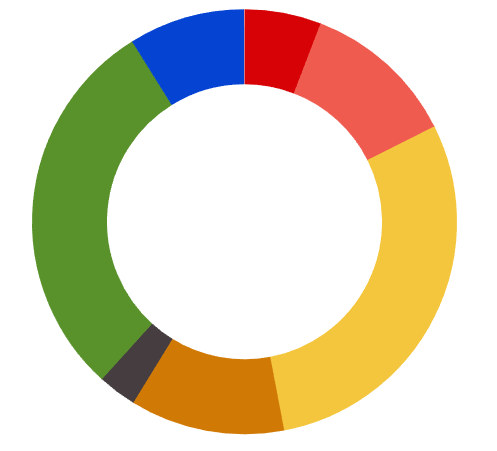
甜甜圈动画
<!DOCTYPE html>
<html>
  <head>
    <link rel="stylesheet" href="./chartist.min.css">
    <script src="./chartist.min.js"></script>
    <script src="https://cdnjs.cloudflare.com/ajax/libs/moment.js/2.29.1/moment.min.js"></script>
  </head>
  <body>
    <div class="ct-chart ct-perfect-fourth" style="width: 500px;height: 350px;"></div>
    <script>
        var chart = new Chartist.Pie('.ct-chart', {
        series: [10, 20, 50, 20, 5, 50, 15],
        labels: [1, 2, 3, 4, 5, 6, 7]
        }, {
        donut: true,
        showLabel: false
        });

        chart.on('draw', function(data) {
        if(data.type === 'slice') {
            // Get the total path length in order to use for dash array animation
            var pathLength = data.element._node.getTotalLength();

            // Set a dasharray that matches the path length as prerequisite to animate dashoffset
            data.element.attr({
            'stroke-dasharray': pathLength + 'px ' + pathLength + 'px'
            });

            // Create animation definition while also assigning an ID to the animation for later sync usage
            var animationDefinition = {
            'stroke-dashoffset': {
                id: 'anim' + data.index,
                dur: 1000,
                from: -pathLength + 'px',
                to:  '0px',
                easing: Chartist.Svg.Easing.easeOutQuint,
                // We need to use `fill: 'freeze'` otherwise our animation will fall back to initial (not visible)
                fill: 'freeze'
            }
            };

            // If this was not the first slice, we need to time the animation so that it uses the end sync event of the previous animation
            if(data.index !== 0) {
            animationDefinition['stroke-dashoffset'].begin = 'anim' + (data.index - 1) + '.end';
            }

            // We need to set an initial value before the animation starts as we are not in guided mode which would do that for us
            data.element.attr({
            'stroke-dashoffset': -pathLength + 'px'
            });

            // We can't use guided mode as the animations need to rely on setting begin manually
            // See http://gionkunz.github.io/chartist-js/api-documentation.html#chartistsvg-function-animate
            data.element.animate(animationDefinition, false);
        }
        });

        // For the sake of the example we update the chart every time it's created with a delay of 8 seconds
        chart.on('created', function() {
        if(window.__anim21278907124) {
            clearTimeout(window.__anim21278907124);
            window.__anim21278907124 = null;
        }
        window.__anim21278907124 = setTimeout(chart.update.bind(chart), 10000);
        });

    </script>
  </body>
</html>
点击查看详情
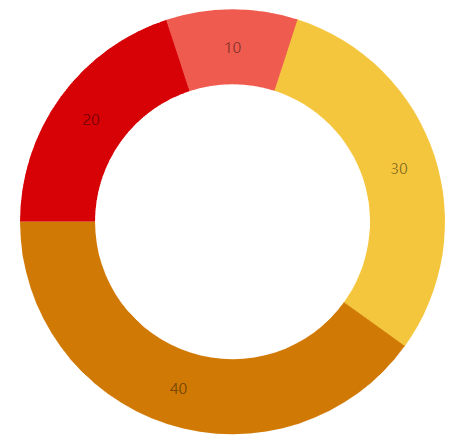
填充圆环图
<!DOCTYPE html>
<html>
  <head>
    <link rel="stylesheet" href="./chartist.min.css">
    <script src="./chartist.min.js"></script>
    <script src="https://cdnjs.cloudflare.com/ajax/libs/moment.js/2.29.1/moment.min.js"></script>
  </head>
  <body>
    <div class="ct-chart ct-perfect-fourth" style="width: 500px;height: 350px;"></div>
    <script>
        new Chartist.Pie('.ct-chart', {
        series: [20, 10, 30, 40]
        }, {
        donut: true,
        donutWidth: 60,
        donutSolid: true,
        startAngle: 270,
        showLabel: true
        });

    </script>
  </body>
</html>
点击查看详情
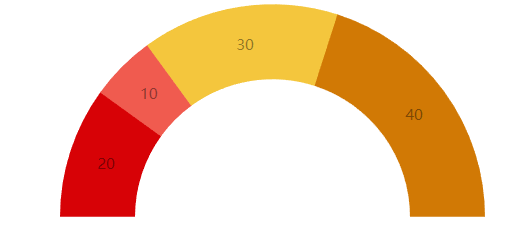
填充仪表图
<!DOCTYPE html>
<html>
  <head>
    <link rel="stylesheet" href="./chartist.min.css">
    <script src="./chartist.min.js"></script>
    <script src="https://cdnjs.cloudflare.com/ajax/libs/moment.js/2.29.1/moment.min.js"></script>
  </head>
  <body>
    <div class="ct-chart ct-perfect-fourth" style="width: 500px;height: 350px;"></div>
    <script>
        new Chartist.Pie('.ct-chart', {
        series: [20, 10, 30, 40]
        }, {
        donut: true,
        donutWidth: 60,
        donutSolid: true,
        startAngle: 270,
        total: 200,
        showLabel: true
        });

    </script>
  </body>
</html>
点击查看详情

 浙公网安备 33010602011771号