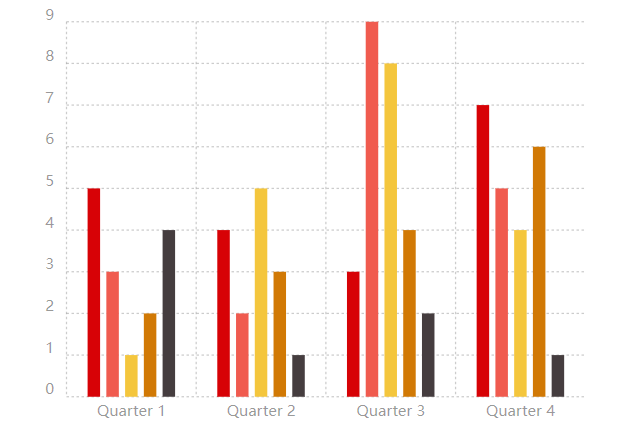
响应配置
<!DOCTYPE html>
<html>
  <head>
    <link rel="stylesheet" href="./chartist.min.css">
    <script src="./chartist.min.js"></script>
    <script src="https://cdnjs.cloudflare.com/ajax/libs/moment.js/2.29.1/moment.min.js"></script>
  </head>
  <body>
    <div class="ct-chart ct-perfect-fourth" style="width: 500px;height: 350px;"></div>
    <script>
        new Chartist.Bar('.ct-chart', {
        labels: ['Quarter 1', 'Quarter 2', 'Quarter 3', 'Quarter 4'],
        series: [
            [5, 4, 3, 7],
            [3, 2, 9, 5],
            [1, 5, 8, 4],
            [2, 3, 4, 6],
            [4, 1, 2, 1]
        ]
        }, {
        // Default mobile configuration
        stackBars: true,
        axisX: {
            labelInterpolationFnc: function(value) {
            return value.split(/\s+/).map(function(word) {
                return word[0];
            }).join('');
            }
        },
        axisY: {
            offset: 20
        }
        }, [
        // Options override for media > 400px
        ['screen and (min-width: 400px)', {
            reverseData: true,
            horizontalBars: true,
            axisX: {
            labelInterpolationFnc: Chartist.noop
            },
            axisY: {
            offset: 60
            }
        }],
        // Options override for media > 800px
        ['screen and (min-width: 800px)', {
            stackBars: false,
            seriesBarDistance: 10
        }],
        // Options override for media > 1000px
        ['screen and (min-width: 1000px)', {
            reverseData: false,
            horizontalBars: false,
            seriesBarDistance: 15
        }]
        ]);
    </script>
  </body>
</html>
点击查看详情
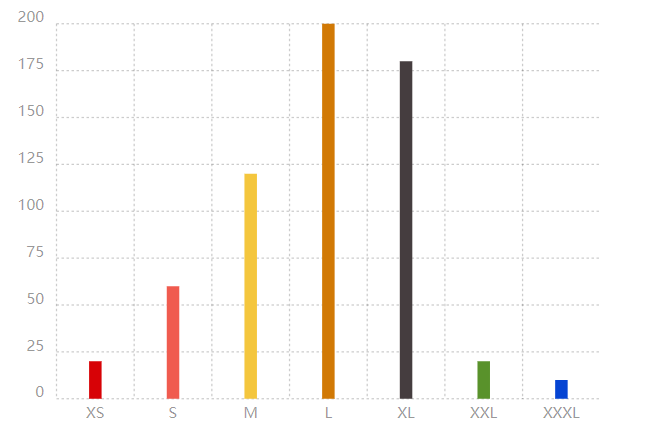
分布式
<!DOCTYPE html>
<html>
  <head>
    <link rel="stylesheet" href="./chartist.min.css">
    <script src="./chartist.min.js"></script>
    <script src="https://cdnjs.cloudflare.com/ajax/libs/moment.js/2.29.1/moment.min.js"></script>
  </head>
  <body>
    <div class="ct-chart ct-perfect-fourth" style="width: 500px;height: 350px;"></div>
    <script>
        new Chartist.Bar('.ct-chart', {
        labels: ['XS', 'S', 'M', 'L', 'XL', 'XXL', 'XXXL'],
        series: [20, 60, 120, 200, 180, 20, 10]
        }, {
        distributeSeries: true
        });

    </script>
  </body>
</html>
点击查看详情
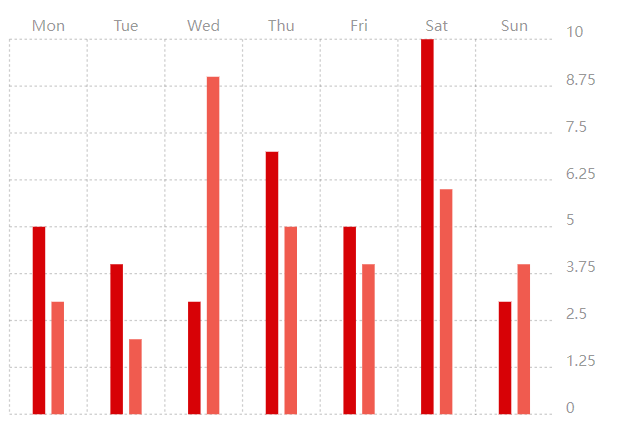
标签放置
<!DOCTYPE html>
<html>
  <head>
    <link rel="stylesheet" href="./chartist.min.css">
    <script src="./chartist.min.js"></script>
    <script src="https://cdnjs.cloudflare.com/ajax/libs/moment.js/2.29.1/moment.min.js"></script>
  </head>
  <body>
    <div class="ct-chart ct-perfect-fourth" style="width: 500px;height: 350px;"></div>
    <script>
        new Chartist.Bar('.ct-chart', {
        labels: ['Mon', 'Tue', 'Wed', 'Thu', 'Fri', 'Sat', 'Sun'],
        series: [
            [5, 4, 3, 7, 5, 10, 3],
            [3, 2, 9, 5, 4, 6, 4]
        ]
        }, {
        axisX: {
            // On the x-axis start means top and end means bottom
            position: 'start'
        },
        axisY: {
            // On the y-axis start means left and end means right
            position: 'end'
        }
        });

    </script>
  </body>
</html>
点击查看详情

 浙公网安备 33010602011771号