多行标签
<!DOCTYPE html>
<html>
  <head>
    <link rel="stylesheet" href="./chartist.min.css">
    <script src="./chartist.min.js"></script>
    <script src="https://cdnjs.cloudflare.com/ajax/libs/moment.js/2.29.1/moment.min.js"></script>
  </head>
  <body>
    <div class="ct-chart ct-perfect-fourth" style="width: 500px;height: 350px;"></div>
    <script>
        new Chartist.Bar('.ct-chart', {
        labels: ['First quarter of the year', 'Second quarter of the year', 'Third quarter of the year', 'Fourth quarter of the year'],
        series: [
            [60000, 40000, 80000, 70000],
            [40000, 30000, 70000, 65000],
            [8000, 3000, 10000, 6000]
        ]
        }, {
        seriesBarDistance: 10,
        axisX: {
            offset: 60
        },
        axisY: {
            offset: 80,
            labelInterpolationFnc: function(value) {
            return value + ' CHF'
            },
            scaleMinSpace: 15
        }
        });
    </script>
  </body>
</html>
点击查看详情

堆积
<!DOCTYPE html>
<html>
  <head>
    <link rel="stylesheet" href="./chartist.min.css">
    <script src="./chartist.min.js"></script>
    <script src="https://cdnjs.cloudflare.com/ajax/libs/moment.js/2.29.1/moment.min.js"></script>
  </head>
  <body>
    <div class="ct-chart ct-perfect-fourth" style="width: 500px;height: 350px;"></div>
    <script>
        new Chartist.Bar('.ct-chart', {
        labels: ['Q1', 'Q2', 'Q3', 'Q4'],
        series: [
            [800000, 1200000, 1400000, 1300000],
            [200000, 400000, 500000, 300000],
            [100000, 200000, 400000, 600000]
        ]
        }, {
        stackBars: true,
        axisY: {
            labelInterpolationFnc: function(value) {
            return (value / 1000) + 'k';
            }
        }
        }).on('draw', function(data) {
        if(data.type === 'bar') {
            data.element.attr({
            style: 'stroke-width: 30px'
            });
        }
        });

    </script>
  </body>
</html>
点击查看详情

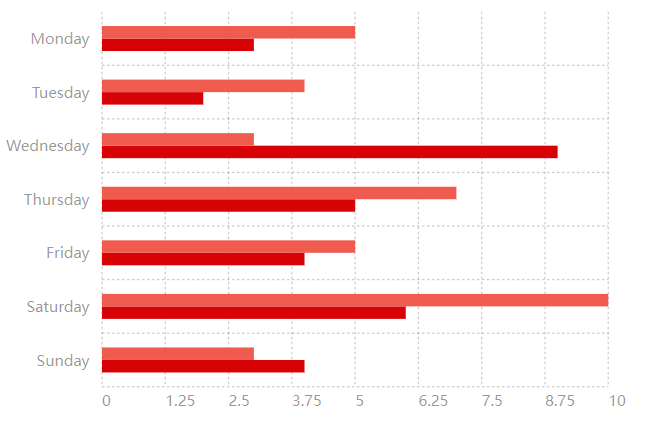
水平
<!DOCTYPE html>
<html>
  <head>
    <link rel="stylesheet" href="./chartist.min.css">
    <script src="./chartist.min.js"></script>
    <script src="https://cdnjs.cloudflare.com/ajax/libs/moment.js/2.29.1/moment.min.js"></script>
  </head>
  <body>
    <div class="ct-chart ct-perfect-fourth" style="width: 500px;height: 350px;"></div>
    <script>
        new Chartist.Bar('.ct-chart', {
        labels: ['Monday', 'Tuesday', 'Wednesday', 'Thursday', 'Friday', 'Saturday', 'Sunday'],
        series: [
            [5, 4, 3, 7, 5, 10, 3],
            [3, 2, 9, 5, 4, 6, 4]
        ]
        }, {
        seriesBarDistance: 10,
        reverseData: true,
        horizontalBars: true,
        axisY: {
            offset: 70
        }
        });

    </script>
  </body>
</html>
点击查看详情

 浙公网安备 33010602011771号