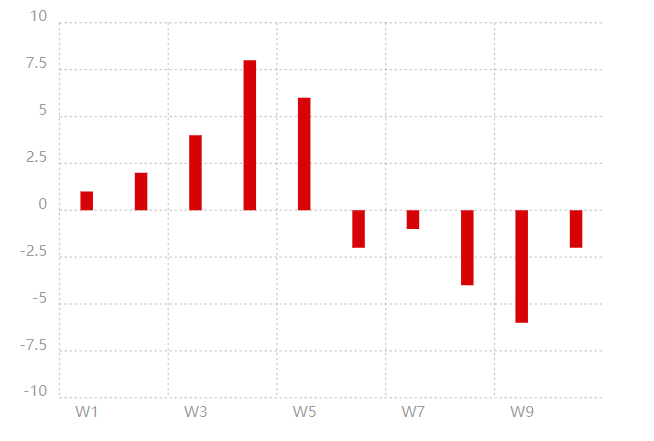
双极条形图
<!DOCTYPE html>
<html>
  <head>
    <link rel="stylesheet" href="./chartist.min.css">
    <script src="./chartist.min.js"></script>
    <script src="https://cdnjs.cloudflare.com/ajax/libs/moment.js/2.29.1/moment.min.js"></script>
  </head>
  <body>
    <div class="ct-chart ct-perfect-fourth" style="width: 500px;height: 350px;"></div>
    <script>
        var data = {
        labels: ['W1', 'W2', 'W3', 'W4', 'W5', 'W6', 'W7', 'W8', 'W9', 'W10'],
        series: [
            [1, 2, 4, 8, 6, -2, -1, -4, -6, -2]
        ]
        };

        var options = {
        high: 10,
        low: -10,
        axisX: {
            labelInterpolationFnc: function(value, index) {
            return index % 2 === 0 ? value : null;
            }
        }
        };

        new Chartist.Bar('.ct-chart', data, options);
    </script>
  </body>
</html>
点击查看详情
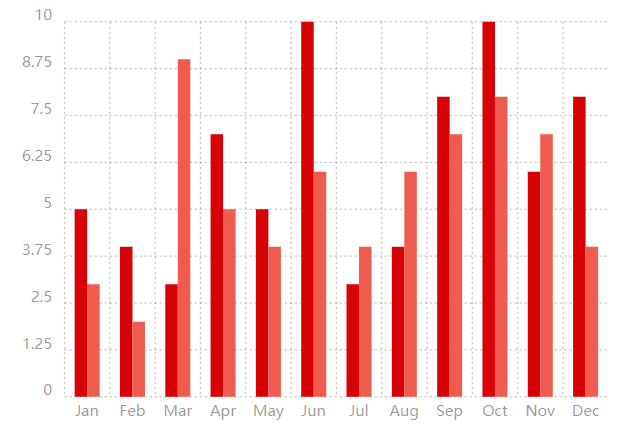
重叠条形图
<!DOCTYPE html>
<html>
  <head>
    <link rel="stylesheet" href="./chartist.min.css">
    <script src="./chartist.min.js"></script>
    <script src="https://cdnjs.cloudflare.com/ajax/libs/moment.js/2.29.1/moment.min.js"></script>
  </head>
  <body>
    <div class="ct-chart ct-perfect-fourth" style="width: 500px;height: 350px;"></div>
    <script>
        var data = {
        labels: ['Jan', 'Feb', 'Mar', 'Apr', 'May', 'Jun', 'Jul', 'Aug', 'Sep', 'Oct', 'Nov', 'Dec'],
        series: [
            [5, 4, 3, 7, 5, 10, 3, 4, 8, 10, 6, 8],
            [3, 2, 9, 5, 4, 6, 4, 6, 7, 8, 7, 4]
        ]
        };

        var options = {
        seriesBarDistance: 10
        };

        var responsiveOptions = [
        ['screen and (max-width: 640px)', {
            seriesBarDistance: 5,
            axisX: {
            labelInterpolationFnc: function (value) {
                return value[0];
            }
            }
        }]
        ];

        new Chartist.Bar('.ct-chart', data, options, responsiveOptions);

    </script>
  </body>
</html>
点击查看详情
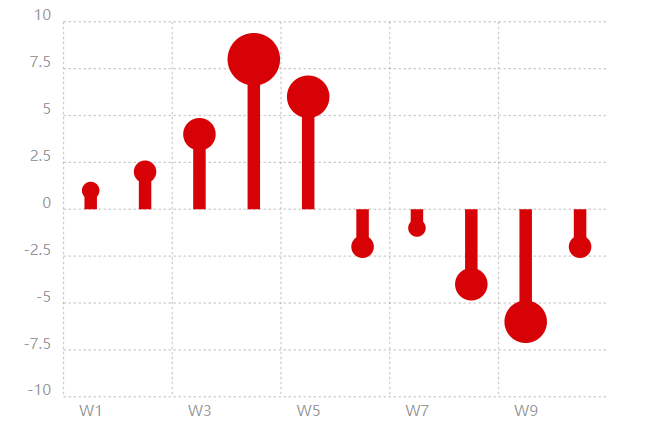
添加峰圈
<!DOCTYPE html>
<html>
  <head>
    <link rel="stylesheet" href="./chartist.min.css">
    <script src="./chartist.min.js"></script>
    <script src="https://cdnjs.cloudflare.com/ajax/libs/moment.js/2.29.1/moment.min.js"></script>
  </head>
  <body>
    <div class="ct-chart ct-perfect-fourth" style="width: 500px;height: 350px;"></div>
    <script>
        // Create a simple bi-polar bar chart
        var chart = new Chartist.Bar('.ct-chart', {
        labels: ['W1', 'W2', 'W3', 'W4', 'W5', 'W6', 'W7', 'W8', 'W9', 'W10'],
        series: [
            [1, 2, 4, 8, 6, -2, -1, -4, -6, -2]
        ]
        }, {
        high: 10,
        low: -10,
        axisX: {
            labelInterpolationFnc: function(value, index) {
            return index % 2 === 0 ? value : null;
            }
        }
        });

        // Listen for draw events on the bar chart
        chart.on('draw', function(data) {
        // If this draw event is of type bar we can use the data to create additional content
        if(data.type === 'bar') {
            // We use the group element of the current series to append a simple circle with the bar peek coordinates and a circle radius that is depending on the value
            data.group.append(new Chartist.Svg('circle', {
            cx: data.x2,
            cy: data.y2,
            r: Math.abs(Chartist.getMultiValue(data.value)) * 2 + 5
            }, 'ct-slice-pie'));
        }
        });

    </script>
  </body>
</html>
点击查看详情

 浙公网安备 33010602011771号