线插值/平滑
<!DOCTYPE html>
<html>
  <head>
    <link rel="stylesheet" href="./chartist.min.css">
    <script src="./chartist.min.js"></script>
  </head>
  <body>
    <div class="ct-chart ct-perfect-fourth" style="width: 500px;height: 350px;"></div>
    <script>
        var chart = new Chartist.Line('.ct-chart', {
        labels: [1, 2, 3, 4, 5],
        series: [
            [1, 5, 10, 0, 1],
            [10, 15, 0, 1, 2]
        ]
        }, {
        // Remove this configuration to see that chart rendered with cardinal spline interpolation
        // Sometimes, on large jumps in data values, it's better to use simple smoothing.
        lineSmooth: Chartist.Interpolation.simple({
            divisor: 2
        }),
        fullWidth: true,
        chartPadding: {
            right: 20
        },
        low: 0
        });

    </script>
  </body>
</html>
点击查看详情

系列覆盖
<!DOCTYPE html>
<html>
  <head>
    <link rel="stylesheet" href="./chartist.min.css">
    <script src="./chartist.min.js"></script>
  </head>
  <body>
    <div class="ct-chart ct-perfect-fourth" style="width: 500px;height: 350px;"></div>
    <script>
        var chart = new Chartist.Line('.ct-chart', {
        labels: ['1', '2', '3', '4', '5', '6', '7', '8'],
        // Naming the series with the series object array notation
        series: [{
            name: 'series-1',
            data: [5, 2, -4, 2, 0, -2, 5, -3]
        }, {
            name: 'series-2',
            data: [4, 3, 5, 3, 1, 3, 6, 4]
        }, {
            name: 'series-3',
            data: [2, 4, 3, 1, 4, 5, 3, 2]
        }]
        }, {
        fullWidth: true,
        // Within the series options you can use the series names
        // to specify configuration that will only be used for the
        // specific series.
        series: {
            'series-1': {
            lineSmooth: Chartist.Interpolation.step()
            },
            'series-2': {
            lineSmooth: Chartist.Interpolation.simple(),
            showArea: true
            },
            'series-3': {
            showPoint: false
            }
        }
        }, [
        // You can even use responsive configuration overrides to
        // customize your series configuration even further!
        ['screen and (max-width: 320px)', {
            series: {
            'series-1': {
                lineSmooth: Chartist.Interpolation.none()
            },
            'series-2': {
                lineSmooth: Chartist.Interpolation.none(),
                showArea: false
            },
            'series-3': {
                lineSmooth: Chartist.Interpolation.none(),
                showPoint: true
            }
            }
        }]
        ]);

    </script>
  </body>
</html>
点击查看详情

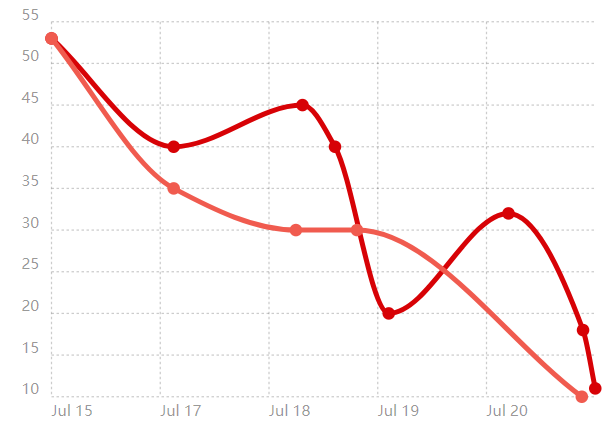
时间序列
<!DOCTYPE html>
<html>
  <head>
    <link rel="stylesheet" href="./chartist.min.css">
    <script src="./chartist.min.js"></script>
    <script src="https://cdnjs.cloudflare.com/ajax/libs/moment.js/2.29.1/moment.min.js"></script>
  </head>
  <body>
    <div class="ct-chart ct-perfect-fourth" style="width: 500px;height: 350px;"></div>
    <script>
        // Requires Moment.js

        var chart = new Chartist.Line('.ct-chart', {
        series: [
            {
            name: 'series-1',
            data: [
                {x: new Date(143134652600), y: 53},
                {x: new Date(143234652600), y: 40},
                {x: new Date(143340052600), y: 45},
                {x: new Date(143366652600), y: 40},
                {x: new Date(143410652600), y: 20},
                {x: new Date(143508652600), y: 32},
                {x: new Date(143569652600), y: 18},
                {x: new Date(143579652600), y: 11}
            ]
            },
            {
            name: 'series-2',
            data: [
                {x: new Date(143134652600), y: 53},
                {x: new Date(143234652600), y: 35},
                {x: new Date(143334652600), y: 30},
                {x: new Date(143384652600), y: 30},
                {x: new Date(143568652600), y: 10}
            ]
            }
        ]
        }, {
        axisX: {
            type: Chartist.FixedScaleAxis,
            divisor: 5,
            labelInterpolationFnc: function(value) {
            return moment(value).format('MMM D');
            }
        }
        });
    </script>
  </body>
</html>
点击查看详情

 浙公网安备 33010602011771号