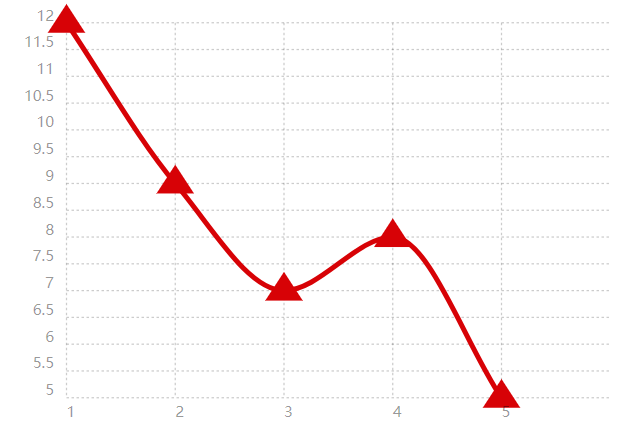
事件替换图形
<!DOCTYPE html>
<html>
  <head>
    <link rel="stylesheet" href="./chartist.min.css">
    <script src="./chartist.min.js"></script>
  </head>
  <body>
    <div class="ct-chart ct-perfect-fourth" style="width: 500px;height: 350px;"></div>
    <script>
        var chart = new Chartist.Line('.ct-chart', {
        labels: [1, 2, 3, 4, 5],
        series: [
            [12, 9, 7, 8, 5]
        ]
        });

        // Listening for draw events that get emitted by the Chartist chart
        chart.on('draw', function(data) {
        // If the draw event was triggered from drawing a point on the line chart
        if(data.type === 'point') {
            // We are creating a new path SVG element that draws a triangle around the point coordinates
            var triangle = new Chartist.Svg('path', {
            d: ['M',
                data.x,
                data.y - 15,
                'L',
                data.x - 15,
                data.y + 8,
                'L',
                data.x + 15,
                data.y + 8,
                'z'].join(' '),
            style: 'fill-opacity: 1'
            }, 'ct-area');

            // With data.element we get the Chartist SVG wrapper and we can replace the original point drawn by Chartist with our newly created triangle
            data.element.replace(triangle);
        }
        });

    </script>
  </body>
</html>
点击查看详情
SMIL动画
<!DOCTYPE html>
<html>
  <head>
    <link rel="stylesheet" href="./chartist.min.css">
    <script src="./chartist.min.js"></script>
  </head>
  <body>
    <div class="ct-chart ct-perfect-fourth" style="width: 500px;height: 350px;"></div>
    <script>
        var chart = new Chartist.Line('.ct-chart', {
        labels: ['1', '2', '3', '4', '5', '6', '7', '8', '9', '10', '11', '12'],
        series: [
            [12, 9, 7, 8, 5, 4, 6, 2, 3, 3, 4, 6],
            [4,  5, 3, 7, 3, 5, 5, 3, 4, 4, 5, 5],
            [5,  3, 4, 5, 6, 3, 3, 4, 5, 6, 3, 4],
            [3,  4, 5, 6, 7, 6, 4, 5, 6, 7, 6, 3]
        ]
        }, {
        low: 0
        });

        // Let's put a sequence number aside so we can use it in the event callbacks
        var seq = 0,
        delays = 80,
        durations = 500;

        // Once the chart is fully created we reset the sequence
        chart.on('created', function() {
        seq = 0;
        });

        // On each drawn element by Chartist we use the Chartist.Svg API to trigger SMIL animations
        chart.on('draw', function(data) {
        seq++;

        if(data.type === 'line') {
            // If the drawn element is a line we do a simple opacity fade in. This could also be achieved using CSS3 animations.
            data.element.animate({
            opacity: {
                // The delay when we like to start the animation
                begin: seq * delays + 1000,
                // Duration of the animation
                dur: durations,
                // The value where the animation should start
                from: 0,
                // The value where it should end
                to: 1
            }
            });
        } else if(data.type === 'label' && data.axis === 'x') {
            data.element.animate({
            y: {
                begin: seq * delays,
                dur: durations,
                from: data.y + 100,
                to: data.y,
                // We can specify an easing function from Chartist.Svg.Easing
                easing: 'easeOutQuart'
            }
            });
        } else if(data.type === 'label' && data.axis === 'y') {
            data.element.animate({
            x: {
                begin: seq * delays,
                dur: durations,
                from: data.x - 100,
                to: data.x,
                easing: 'easeOutQuart'
            }
            });
        } else if(data.type === 'point') {
            data.element.animate({
            x1: {
                begin: seq * delays,
                dur: durations,
                from: data.x - 10,
                to: data.x,
                easing: 'easeOutQuart'
            },
            x2: {
                begin: seq * delays,
                dur: durations,
                from: data.x - 10,
                to: data.x,
                easing: 'easeOutQuart'
            },
            opacity: {
                begin: seq * delays,
                dur: durations,
                from: 0,
                to: 1,
                easing: 'easeOutQuart'
            }
            });
        } else if(data.type === 'grid') {
            // Using data.axis we get x or y which we can use to construct our animation definition objects
            var pos1Animation = {
            begin: seq * delays,
            dur: durations,
            from: data[data.axis.units.pos + '1'] - 30,
            to: data[data.axis.units.pos + '1'],
            easing: 'easeOutQuart'
            };

            var pos2Animation = {
            begin: seq * delays,
            dur: durations,
            from: data[data.axis.units.pos + '2'] - 100,
            to: data[data.axis.units.pos + '2'],
            easing: 'easeOutQuart'
            };

            var animations = {};
            animations[data.axis.units.pos + '1'] = pos1Animation;
            animations[data.axis.units.pos + '2'] = pos2Animation;
            animations['opacity'] = {
            begin: seq * delays,
            dur: durations,
            from: 0,
            to: 1,
            easing: 'easeOutQuart'
            };

            data.element.animate(animations);
        }
        });

        // For the sake of the example we update the chart every time it's created with a delay of 10 seconds
        chart.on('created', function() {
        if(window.__exampleAnimateTimeout) {
            clearTimeout(window.__exampleAnimateTimeout);
            window.__exampleAnimateTimeout = null;
        }
        window.__exampleAnimateTimeout = setTimeout(chart.update.bind(chart), 12000);
        });
    </script>
  </body>
</html>
点击查看详情

SVG路径动画
<!DOCTYPE html>
<html>
  <head>
    <link rel="stylesheet" href="./chartist.min.css">
    <script src="./chartist.min.js"></script>
  </head>
  <body>
    <div class="ct-chart ct-perfect-fourth" style="width: 500px;height: 350px;"></div>
    <script>
        var chart = new Chartist.Line('.ct-chart', {
        labels: ['Mon', 'Tue', 'Wed', 'Thu', 'Fri', 'Sat'],
        series: [
            [1, 5, 2, 5, 4, 3],
            [2, 3, 4, 8, 1, 2],
            [5, 4, 3, 2, 1, 0.5]
        ]
        }, {
        low: 0,
        showArea: true,
        showPoint: false,
        fullWidth: true
        });

        chart.on('draw', function(data) {
        if(data.type === 'line' || data.type === 'area') {
            data.element.animate({
            d: {
                begin: 2000 * data.index,
                dur: 2000,
                from: data.path.clone().scale(1, 0).translate(0, data.chartRect.height()).stringify(),
                to: data.path.clone().stringify(),
                easing: Chartist.Svg.Easing.easeOutQuint
            }
            });
        }
        });

    </script>
  </body>
</html>
点击查看详情


 浙公网安备 33010602011771号