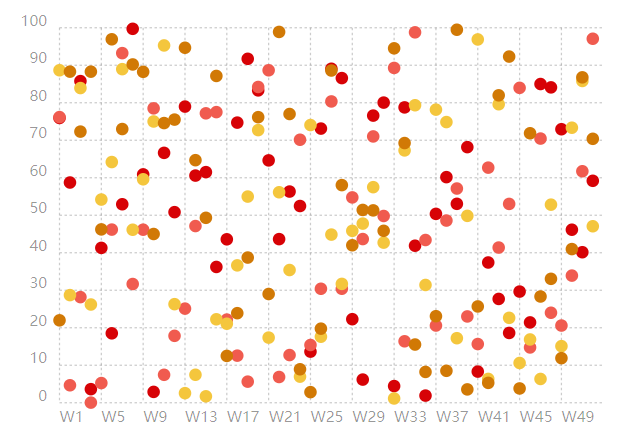
折线散点图
<!DOCTYPE html>
<html>
  <head>
    <link rel="stylesheet" href="./chartist.min.css">
    <script src="./chartist.min.js"></script>
  </head>
  <body>
    <div class="ct-chart ct-perfect-fourth" style="width: 500px;height: 350px;"></div>
    <script>
        var times = function(n) {
        return Array.apply(null, new Array(n));
        };

        var data = times(52).map(Math.random).reduce(function(data, rnd, index) {
        data.labels.push(index + 1);
        data.series.forEach(function(series) {
            series.push(Math.random() * 100)
        });

        return data;
        }, {
        labels: [],
        series: times(4).map(function() { return new Array() })
        });

        var options = {
        showLine: false,
        axisX: {
            labelInterpolationFnc: function(value, index) {
            return index % 13 === 0 ? 'W' + value : null;
            }
        }
        };

        var responsiveOptions = [
        ['screen and (min-width: 640px)', {
            axisX: {
            labelInterpolationFnc: function(value, index) {
                return index % 4 === 0 ? 'W' + value : null;
            }
            }
        }]
        ];

        new Chartist.Line('.ct-chart', data, options, responsiveOptions);
    </script>
  </body>
</html>
点击查看详情
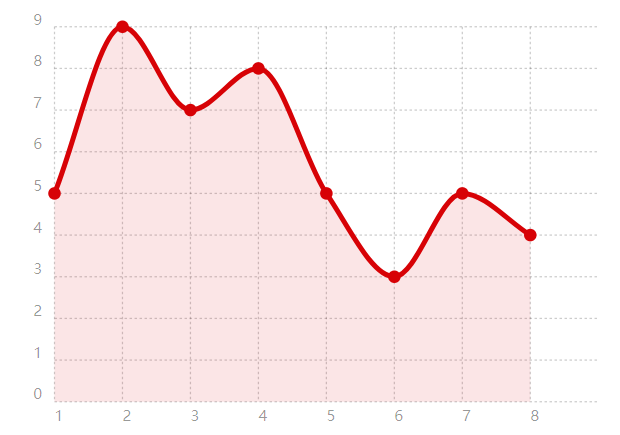
带面积折线图
<!DOCTYPE html>
<html>
  <head>
    <link rel="stylesheet" href="./chartist.min.css">
    <script src="./chartist.min.js"></script>
  </head>
  <body>
    <div class="ct-chart ct-perfect-fourth" style="width: 500px;height: 350px;"></div>
    <script>
        new Chartist.Line('.ct-chart', {
            labels: [1, 2, 3, 4, 5, 6, 7, 8],
            series: [
                [5, 9, 7, 8, 5, 3, 5, 4]
            ]
        }, {
            low: 0,
            showArea: true
        });
    </script>
  </body>
</html>
点击查看详情
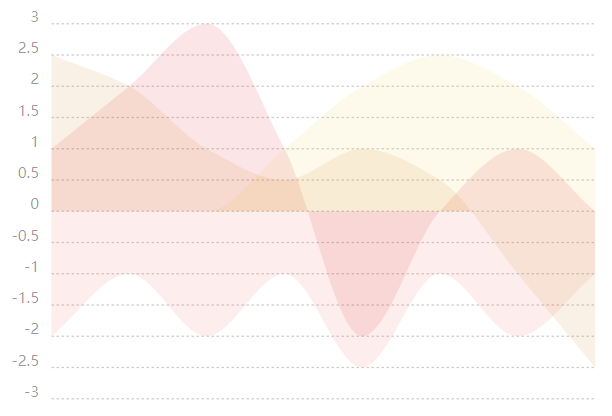
仅带面积的的双极折线图
<!DOCTYPE html>
<html>
  <head>
    <link rel="stylesheet" href="./chartist.min.css">
    <script src="./chartist.min.js"></script>
  </head>
  <body>
    <div class="ct-chart ct-perfect-fourth" style="width: 500px;height: 350px;"></div>
    <script>
        new Chartist.Line('.ct-chart', {
        labels: [1, 2, 3, 4, 5, 6, 7, 8],
        series: [
            [1, 2, 3, 1, -2, 0, 1, 0],
            [-2, -1, -2, -1, -2.5, -1, -2, -1],
            [0, 0, 0, 1, 2, 2.5, 2, 1],
            [2.5, 2, 1, 0.5, 1, 0.5, -1, -2.5]
        ]
        }, {
        high: 3,
        low: -3,
        showArea: true,
        showLine: false,
        showPoint: false,
        fullWidth: true,
        axisX: {
            showLabel: false,
            showGrid: false
        }
        });
    </script>
  </body>
</html>
点击查看详情

 浙公网安备 33010602011771号