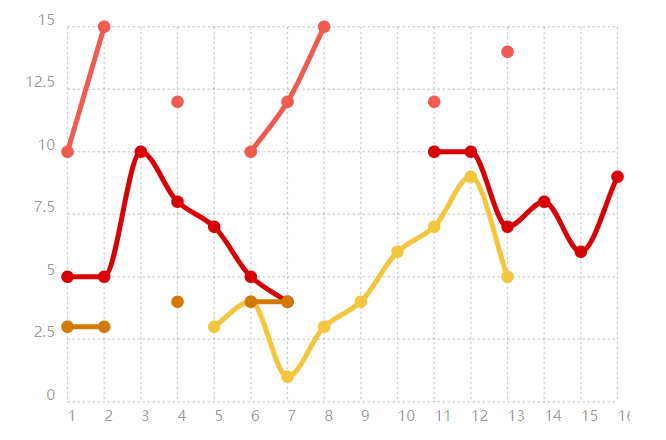
数据漏洞
<!DOCTYPE html>
<html>
  <head>
    <link rel="stylesheet" href="./chartist.min.css">
    <script src="./chartist.min.js"></script>
  </head>
  <body>
    <div class="ct-chart ct-perfect-fourth" style="width: 500px;height: 350px;"></div>
    <script>
        var chart = new Chartist.Line('.ct-chart', {
        labels: [1, 2, 3, 4, 5, 6, 7, 8, 9, 10, 11, 12, 13, 14, 15, 16],
        series: [
            [5, 5, 10, 8, 7, 5, 4, null, null, null, 10, 10, 7, 8, 6, 9],
            [10, 15, null, 12, null, 10, 12, 15, null, null, 12, null, 14, null, null, null],
            [null, null, null, null, 3, 4, 1, 3, 4,  6,  7,  9, 5, null, null, null],
            [{x:3, y: 3},{x: 4, y: 3}, {x: 5, y: undefined}, {x: 6, y: 4}, {x: 7, y: null}, {x: 8, y: 4}, {x: 9, y: 4}]
        ]
        }, {
        fullWidth: true,
        chartPadding: {
            right: 10
        },
        low: 0
        });
    </script>
  </body>
</html>
点击查看详情
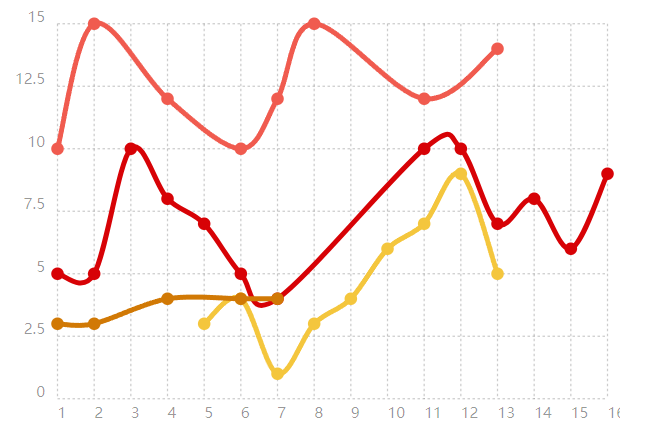
填补数据漏洞
<!DOCTYPE html>
<html>
  <head>
    <link rel="stylesheet" href="./chartist.min.css">
    <script src="./chartist.min.js"></script>
  </head>
  <body>
    <div class="ct-chart ct-perfect-fourth" style="width: 500px;height: 350px;"></div>
    <script>
        var chart = new Chartist.Line('.ct-chart', {
        labels: [1, 2, 3, 4, 5, 6, 7, 8, 9, 10, 11, 12, 13, 14, 15, 16],
        series: [
            [5, 5, 10, 8, 7, 5, 4, null, null, null, 10, 10, 7, 8, 6, 9],
            [10, 15, null, 12, null, 10, 12, 15, null, null, 12, null, 14, null, null, null],
            [null, null, null, null, 3, 4, 1, 3, 4,  6,  7,  9, 5, null, null, null],
            [{x:3, y: 3},{x: 4, y: 3}, {x: 5, y: undefined}, {x: 6, y: 4}, {x: 7, y: null}, {x: 8, y: 4}, {x: 9, y: 4}]
        ]
        }, {
        fullWidth: true,
        chartPadding: {
            right: 10
        },
        lineSmooth: Chartist.Interpolation.cardinal({
            fillHoles: true,
        }),
        low: 0
        });
    </script>
  </body>
</html>
点击查看详情
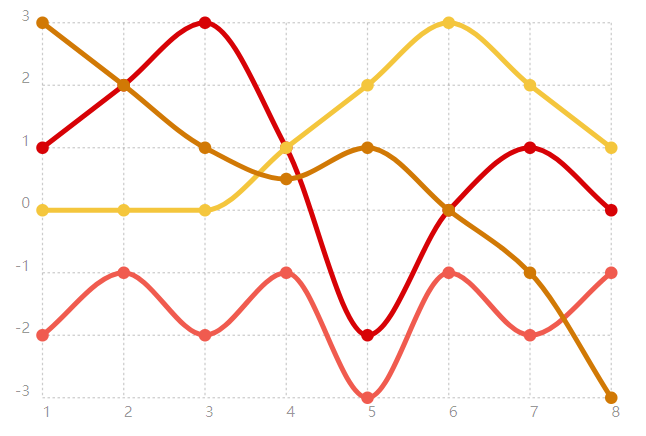
只用整数
<!DOCTYPE html>
<html>
  <head>
    <link rel="stylesheet" href="./chartist.min.css">
    <script src="./chartist.min.js"></script>
  </head>
  <body>
    <div class="ct-chart ct-perfect-fourth" style="width: 500px;height: 350px;"></div>
    <script>
        new Chartist.Line('.ct-chart', {
        labels: [1, 2, 3, 4, 5, 6, 7, 8],
        series: [
            [1, 2, 3, 1, -2, 0, 1, 0],
            [-2, -1, -2, -1, -3, -1, -2, -1],
            [0, 0, 0, 1, 2, 3, 2, 1],
            [3, 2, 1, 0.5, 1, 0, -1, -3]
        ]
        }, {
        high: 3,
        low: -3,
        fullWidth: true,
        // As this is axis specific we need to tell Chartist to use whole numbers only on the concerned axis
        axisY: {
            onlyInteger: true,
            offset: 20
        }
        });
    </script>
  </body>
</html>
点击查看详情

 浙公网安备 33010602011771号