<!doctype html>
<html>
<head>
<title>Timeline</title>
<script type="text/javascript" src="https://unpkg.com/vis-timeline@latest/standalone/umd/vis-timeline-graph2d.min.js"></script>
<link href="https://unpkg.com/vis-timeline@latest/styles/vis-timeline-graph2d.min.css" rel="stylesheet" type="text/css" />
<style type="text/css">
#visualization {
width: 600px;
height: 200px;
border: 1px solid lightgray;
}
</style>
</head>
<body>
<div id="visualization"></div>
<script type="text/javascript">
// DOM element where the Timeline will be attached
var container = document.getElementById('visualization');
// Create a DataSet (allows two way data-binding)
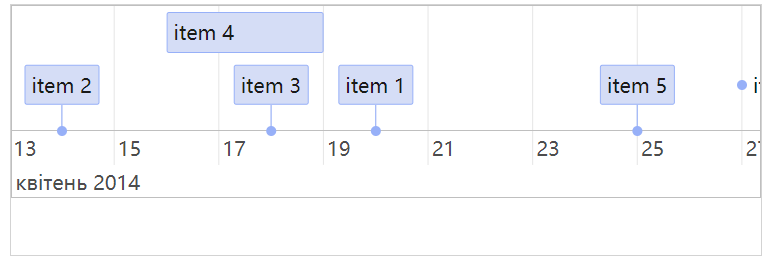
var items = new vis.DataSet([
{id: 1, content: 'item 1', start: '2014-04-20'},
{id: 2, content: 'item 2', start: '2014-04-14'},
{id: 3, content: 'item 3', start: '2014-04-18'},
{id: 4, content: 'item 4', start: '2014-04-16', end: '2014-04-19'},
{id: 5, content: 'item 5', start: '2014-04-25'},
{id: 6, content: 'item 6', start: '2014-04-27', type: 'point'}
]);
// Configuration for the Timeline
var options = {};
// Create a Timeline
var timeline = new vis.Timeline(container, items, options);
</script>
</body>
</html>
点击查看详情

 浙公网安备 33010602011771号