<!DOCTYPE html>
<html>
<head>
<title>Graph 3D demo</title>
<style>
body {
font: 10pt arial;
}
</style>
<script
type="text/javascript"
src="https://unpkg.com/vis-graph3d@latest/dist/vis-graph3d.min.js"
></script>
<script src="https://cdnjs.cloudflare.com/ajax/libs/moment.js/2.29.1/moment.min.js"></script>
<script type="text/javascript">
var data = null;
var graph = null;
function custom(x, y) {
return -Math.sin(x / Math.PI) * Math.cos(y / Math.PI) * 10 + 10;
}
// Called when the Visualization API is loaded.
function drawVisualization() {
var style = document.getElementById("style").value;
var showPerspective = document.getElementById("perspective").checked;
var xBarWidth =
parseFloat(document.getElementById("xBarWidth").value) || undefined;
var yBarWidth =
parseFloat(document.getElementById("yBarWidth").value) || undefined;
var withValue =
["bar-color", "bar-size", "dot-size", "dot-color"].indexOf(style) != -1;
// Create and populate a data table.
data = [];
// create some nice looking data with sin/cos
var steps = 5; // number of datapoints will be steps*steps
var axisMax = 10;
var axisStep = axisMax / steps;
for (var x = 0; x <= axisMax; x += axisStep) {
for (var y = 0; y <= axisMax; y += axisStep) {
var z = custom(x, y);
if (withValue) {
var value = y - x;
data.push({ x: x, y: y, z: z, style: value });
} else {
data.push({ x: x, y: y, z: z });
}
}
}
// specify options
var options = {
width: "600px",
height: "600px",
style: style,
xBarWidth: xBarWidth,
yBarWidth: yBarWidth,
showPerspective: showPerspective,
showGrid: true,
showShadow: false,
keepAspectRatio: true,
verticalRatio: 0.5,
};
var camera = graph ? graph.getCameraPosition() : null;
// create our graph
var container = document.getElementById("mygraph");
graph = new vis.Graph3d(container, data, options);
if (camera) graph.setCameraPosition(camera); // restore camera position
document.getElementById("style").onchange = drawVisualization;
document.getElementById("perspective").onchange = drawVisualization;
document.getElementById("xBarWidth").onchange = drawVisualization;
document.getElementById("yBarWidth").onchange = drawVisualization;
}
window.addEventListener("load", () => {
drawVisualization();
});
</script>
</head>
<body onload="drawVisualization();">
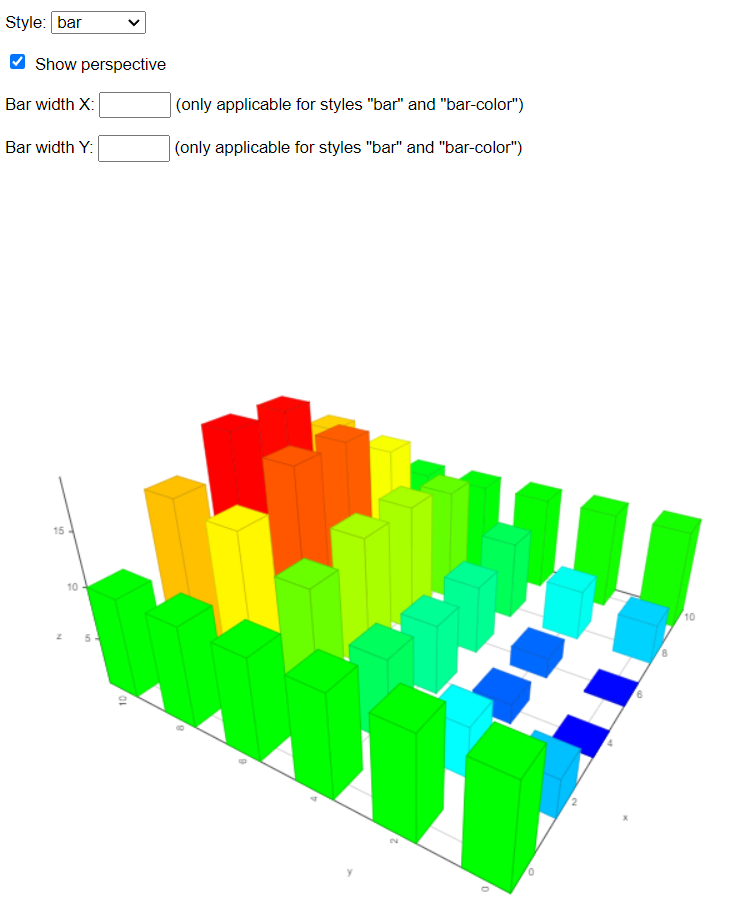
<p>
<label for="style">
Style:
<select id="style">
<option value="bar">bar</option>
<option value="bar-color">bar-color</option>
<option value="bar-size">bar-size</option>
<option value="dot">dot</option>
<option value="dot-line">dot-line</option>
<option value="dot-color">dot-color</option>
<option value="dot-size">dot-size</option>
<option value="grid">grid</option>
<option value="line">line</option>
<option value="surface">surface</option>
</select>
</label>
</p>
<p>
<label for="perspective">
<input type="checkbox" id="perspective" checked="" /> Show perspective
</label>
</p>
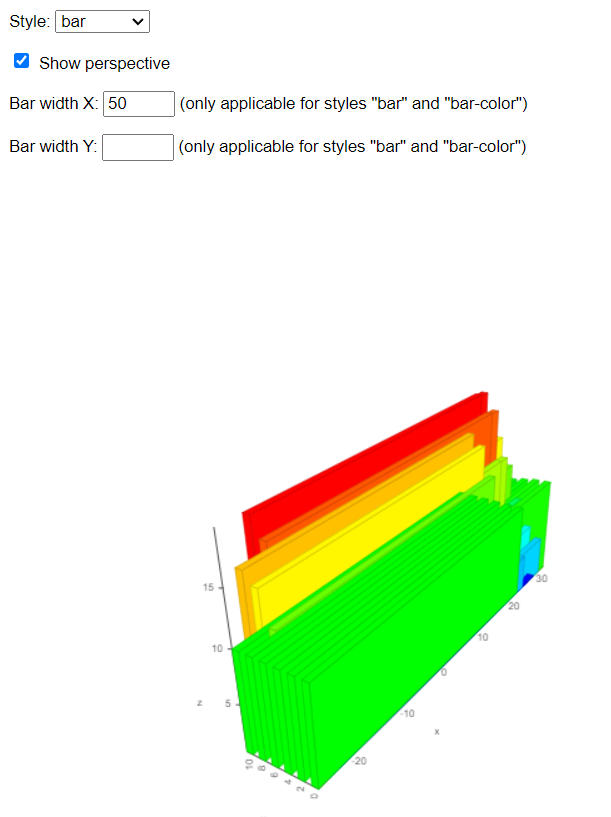
<p>
<label for="xBarWidth">
Bar width X:
<input type="text" id="xBarWidth" value="" style="width: 50px" /> (only
applicable for styles "bar" and "bar-color")
</label>
</p>
<p>
<label for="yBarWidth">
Bar width Y:
<input type="text" id="yBarWidth" value="" style="width: 50px" /> (only
applicable for styles "bar" and "bar-color")
</label>
</p>
<div id="mygraph"></div>
<div id="info"></div>
</body>
</html>
点击查看详情

 浙公网安备 33010602011771号