<!DOCTYPE html>
<html>
<head>
<title>Graph 3D demo</title>
<style>
body {
font: 10pt arial;
}
</style>
<script
type="text/javascript"
src="https://unpkg.com/vis-graph3d@latest/dist/vis-graph3d.min.js"
></script>
<script src="https://cdnjs.cloudflare.com/ajax/libs/moment.js/2.29.1/moment.min.js"></script>
<script type="text/javascript">
var data = null;
var graph = null;
// Called when the Visualization API is loaded.
function drawVisualization() {
// Create and populate a data table.
data = new vis.DataSet();
// create some nice looking data with sin/cos
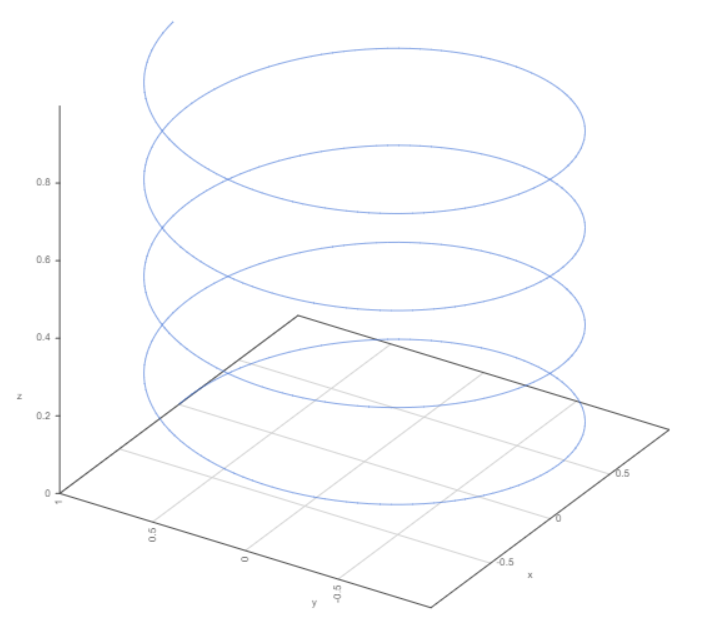
var steps = 500;
var axisMax = 314;
var tmax = 4 * 2 * Math.PI;
var axisStep = axisMax / steps;
for (var t = 0; t < tmax; t += tmax / steps) {
var r = 1;
var x = r * Math.sin(t);
var y = r * Math.cos(t);
var z = t / tmax;
data.add({ x: x, y: y, z: z });
}
// specify options
var options = {
width: "600px",
height: "600px",
style: "line",
showPerspective: false,
showGrid: true,
keepAspectRatio: true,
verticalRatio: 1.0,
};
// create our graph
var container = document.getElementById("mygraph");
graph = new vis.Graph3d(container, data, options);
graph.setCameraPosition(0.4, undefined, undefined);
}
window.addEventListener("load", () => {
drawVisualization();
});
</script>
</head>
<body onload="drawVisualization();">
<div id="mygraph"></div>
<div id="info"></div>
</body>
</html>
点击查看详情

 浙公网安备 33010602011771号