<!DOCTYPE html>
<html>
<head>
<title>Graph 3D demo</title>
<style>
body {
font: 10pt arial;
}
</style>
<script
type="text/javascript"
src="https://unpkg.com/vis-graph3d@latest/dist/vis-graph3d.min.js"
></script>
<script type="text/javascript">
var data = null;
var graph = null;
// Called when the Visualization API is loaded.
function drawVisualization() {
// create the data table.
data = new vis.DataSet();
// create some shortcuts to math functions
var sqrt = Math.sqrt;
var pow = Math.pow;
var random = Math.random;
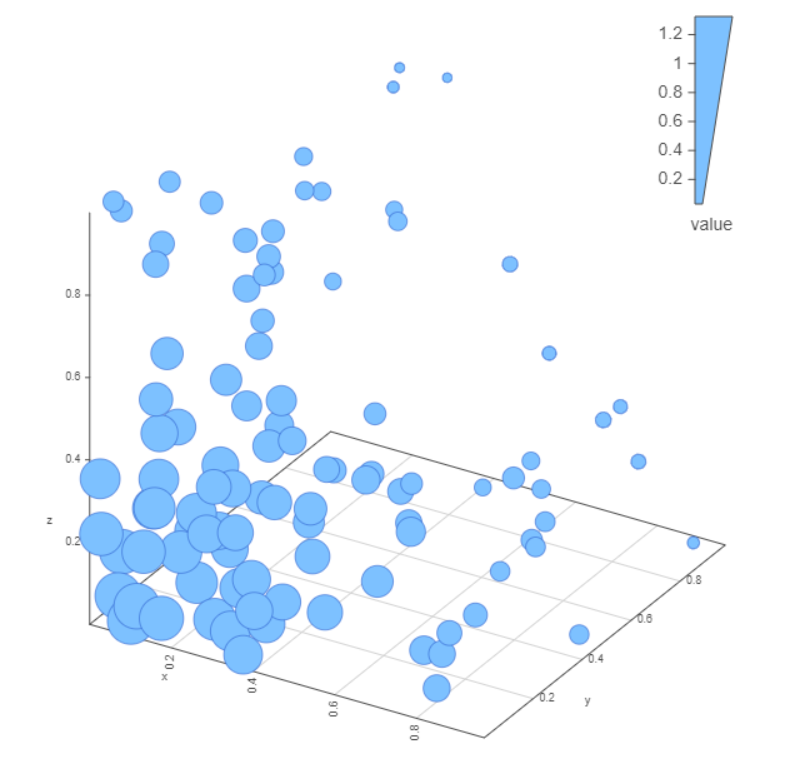
// create the animation data
var imax = 100;
for (var i = 0; i < imax; i++) {
var x = pow(random(), 2);
var y = pow(random(), 2);
var z = pow(random(), 2);
var dist = sqrt(pow(x, 2) + pow(y, 2) + pow(z, 2));
var range = sqrt(2) - dist;
data.add({ x: x, y: y, z: z, style: range });
}
// specify options
var options = {
width: "600px",
height: "600px",
style: "dot-size",
showPerspective: false,
showGrid: true,
keepAspectRatio: true,
legendLabel: "value",
verticalRatio: 1.0,
cameraPosition: {
horizontal: -0.54,
vertical: 0.5,
distance: 1.6,
},
dotSizeMinFraction: 0.5,
dotSizeMaxFraction: 2.5,
};
// create our graph
var container = document.getElementById("mygraph");
graph = new vis.Graph3d(container, data, options);
}
window.addEventListener("load", () => {
drawVisualization();
});
</script>
</head>
<body onload="drawVisualization();">
<div id="mygraph"></div>
<div id="info"></div>
</body>
</html>
点击查看详情

 浙公网安备 33010602011771号