<!DOCTYPE html>
<html>
<head>
<title>Graph 3D demo</title>
<style>
body {
font: 10pt arial;
}
fieldset {
width: fit-content;
}
fieldset > div {
float: left;
}
fieldset > div + div {
margin-left: 100px;
}
</style>
<script
type="text/javascript"
src="https://unpkg.com/vis-graph3d@latest/dist/vis-graph3d.min.js"
></script>
<script type="text/javascript">
var data = null;
var graph = null;
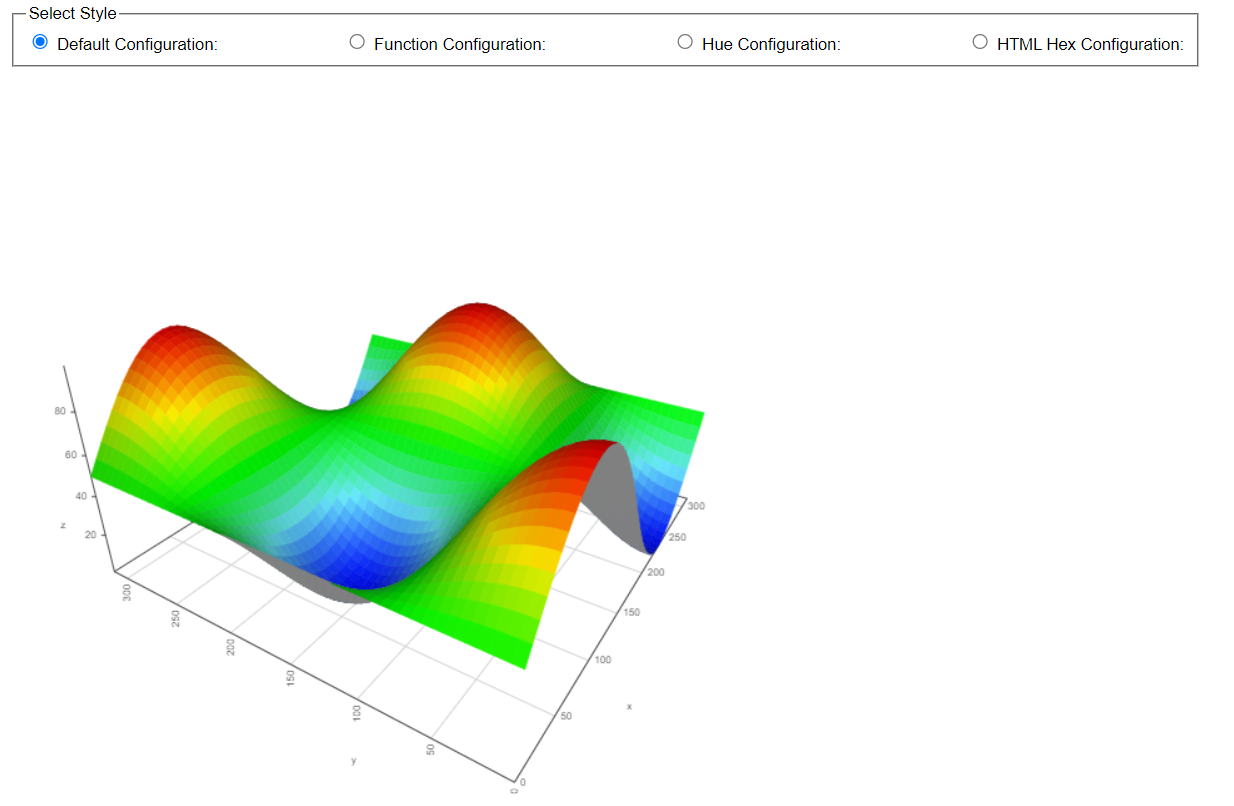
function custom(x, y) {
return Math.sin(x / 50) * Math.cos(y / 50) * 50 + 50;
}
// Called when the Visualization API is loaded.
function drawVisualization() {
var radioButtons = document.getElementsByName("style");
var selectedRadio = null;
radioButtons.forEach(function (radioButton) {
if (radioButton.checked === true) {
selectedRadio = radioButton;
}
});
const style = (selectedRadio && selectedRadio.value) || null;
// Create and populate a data table.
data = new vis.DataSet();
// create some nice looking data with sin/cos
var counter = 0;
var steps = 50; // number of datapoints will be steps*steps
var axisMax = 314;
var axisStep = axisMax / steps;
for (var x = 0; x < axisMax; x += axisStep) {
for (var y = 0; y < axisMax; y += axisStep) {
var value = custom(x, y);
data.add({ id: counter++, x: x, y: y, z: value, style: value });
}
}
// specify options
var options = {
width: "600px",
height: "600px",
style: "surface",
showPerspective: true,
showGrayBottom: true,
showGrid: true,
showShadow: true,
showSurfaceGrid: false,
keepAspectRatio: true,
verticalRatio: 0.5,
};
if (style === "default") {
options.colormap = ["#000FFF", "#68E8FB", "#00FF00", "#FFF000", "#FF0000"];
} else if (style === "function") {
options.colormap = function (x) {
return { r: 255 * x, g: 0, b: 0, a: (1 + x) / 2 };
};
} else if (style === "hue") {
options.colormap = {
hue: {
start: 360,
end: -360,
saturation: 50,
brightness: 100,
colorStops: 8, // How many colour gradients do we want
},
};
} else if (style === "html") {
options.colormap = ["#000000", "#6A0DAD", "#FFFFFF"];
} // else use defaults.
// Instantiate our graph object.
var container = document.getElementById("mygraph");
graph = new vis.Graph3d(container, data, options);
}
window.addEventListener("load", () => {
drawVisualization();
});
</script>
</head>
<body onload="drawVisualization();">
<fieldset>
<legend>Select Style</legend>
<div>
<input
type="radio"
name="style"
id="defaultStyle"
value="default"
checked="checked"
onchange="drawVisualization();"
/>
<label for="defaultStyle">Default Configuration: </label>
<!-- <code>
<pre>
colormap: [
'#000FFF',
'#68E8FB',
'#00FF00',
'#FFF000',
'#FF0000',
]</pre
>
</code> -->
</div>
<div>
<input
type="radio"
name="style"
id="functionStyle"
value="function"
onchange="drawVisualization();"
/>
<label for="functionStyle">Function Configuration:</label>
<!-- <code>
<pre>
colormap: function(x) {
return {r: 255*x, g: 0, b: 0, a: (1+x)/2};
}</pre
>
</code> -->
</div>
<div>
<input
type="radio"
name="style"
id="hueStyle"
value="hue"
onchange="drawVisualization();"
/>
<label for="hueStyle">Hue Configuration:</label>
<!-- <code>
<pre>
colormap: {
hue: {
start: 360,
end: -360,
saturation: 50,
brightness: 100,
colorStops: 8,
}
}</pre
>
</code> -->
</div>
<div>
<input
type="radio"
name="style"
id="htmlStyle"
value="html"
onchange="drawVisualization();"
/>
<label for="htmlStyle">HTML Hex Configuration:</label>
<!-- <code>
<pre>
colormap: [
'#000000',
'#6A0DAD',
'#FFFFFF',
]</pre
>
</code> -->
</div>
</fieldset>
<div id="mygraph"></div>
</body>
</html>
点击查看详情

 浙公网安备 33010602011771号