vis.js绘制3d图形
案例1
- 代码案例
<!DOCTYPE html>
<html>
  <head>
    <title>Graph 3D demo</title>
    <script
      type="text/javascript"
      src="https://unpkg.com/vis-graph3d@latest/dist/vis-graph3d.min.js"
    ></script>
    <script type="text/javascript">
      var data = null;
      var graph = null;

      function custom(x, y) {
        return Math.sin(x / 50) * Math.cos(y / 50) * 50 + 50;
      }

      // Called when the Visualization API is loaded.
      function drawVisualization() {
        // Create and populate a data table.
        data = new vis.DataSet();
        // create some nice looking data with sin/cos
        var counter = 0;
        var steps = 50; // number of datapoints will be steps*steps
        var axisMax = 314;
        var axisStep = axisMax / steps;
        for (var x = 0; x < axisMax; x += axisStep) {
          for (var y = 0; y < axisMax; y += axisStep) {
            var value = custom(x, y);
            data.add({ id: counter++, x: x, y: y, z: value, style: value });
          }
        }

        // specify options
        var options = {
          width: "600px",
          height: "600px",
          style: "surface",
          showPerspective: true,
          showGrid: true,
          showShadow: false,
          keepAspectRatio: true,
          verticalRatio: 0.5,
        };

        // Instantiate our graph object.
        var container = document.getElementById("mygraph");
        graph = new vis.Graph3d(container, data, options);
      }
    </script>
  </head>
  <body onload="drawVisualization();">
    <div id="mygraph"></div>
  </body>
</html>
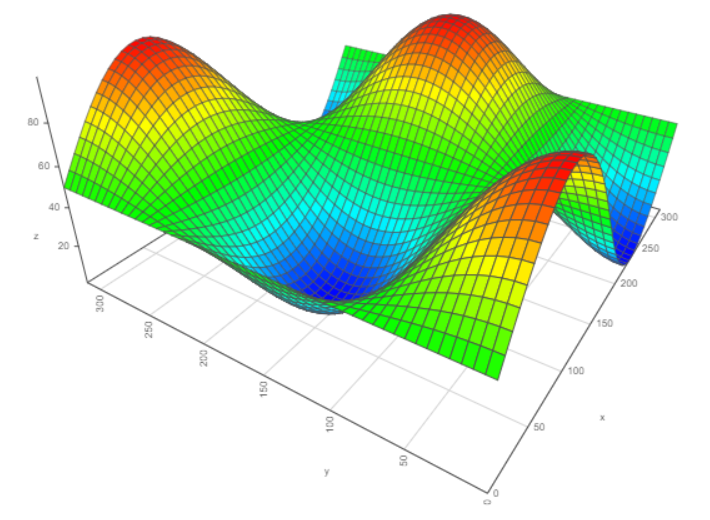
- 效果图
点击查看详情

案例2
- 代码案例
<!DOCTYPE html>
<html>
  <head>
    <title>Graph 3D demo</title>
    <style>
        body {
            font: 10pt arial;
        }
    </style>
    <script
      type="text/javascript"
      src="https://unpkg.com/vis-graph3d@latest/dist/vis-graph3d.min.js"
    ></script>
    <script type="text/javascript">
        var data = null;
        var graph = null;

        function custom(x, y) {
        return Math.sin(x / 50) * Math.cos(y / 50) * 50 + 50;
        }

        // Called when the Visualization API is loaded.
        function drawVisualization() {
        // Create and populate a data table.
        data = new vis.DataSet();
        // create some nice looking data with sin/cos
        var counter = 0;
        var steps = 50; // number of datapoints will be steps*steps
        var axisMax = 314;
        var axisStep = axisMax / steps;
        for (var x = 0; x < axisMax; x += axisStep) {
            for (var y = 0; y < axisMax; y += axisStep) {
            var value = custom(x, y);
            data.add({ id: counter++, x: x, y: y, z: value, style: value });
            }
        }

        // specify options
        var options = {
            width: "600px",
            height: "600px",
            style: "surface",
            showPerspective: true,
            showGrid: true,
            showShadow: false,
            keepAspectRatio: true,
            verticalRatio: 0.5,
        };

        // Instantiate our graph object.
        var container = document.getElementById("mygraph");
        graph = new vis.Graph3d(container, data, options);
        }

        window.addEventListener("load", () => {
        drawVisualization();
        });

    </script>
  </head>
  <body onload="drawVisualization();">
    <div id="mygraph"></div>

    <div id="info"></div>
  </body>
</html>
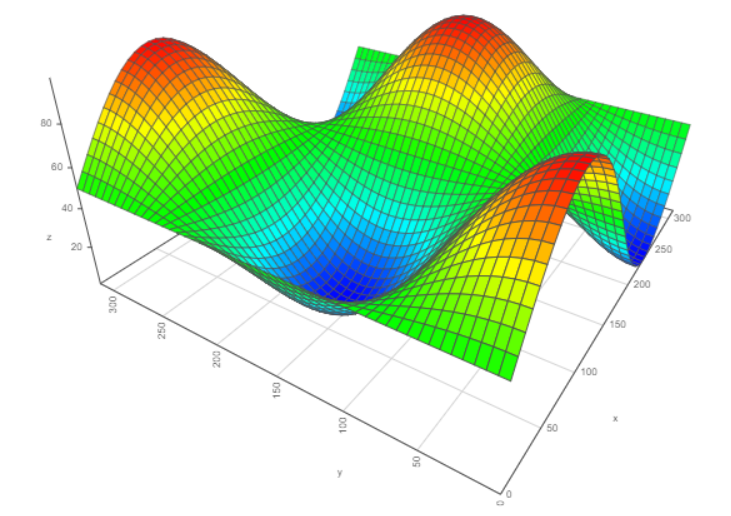
- 效果图
点击查看详情
-
Basics
-
Disable Zoom(禁止缩放),添加如下
var options = {
    zoomable: false,
  };
- Zoom CTRL Scroll(缩放CTRL滚动),添加如下
var options = {
    ctrlToZoom: true,
  };

 浙公网安备 33010602011771号