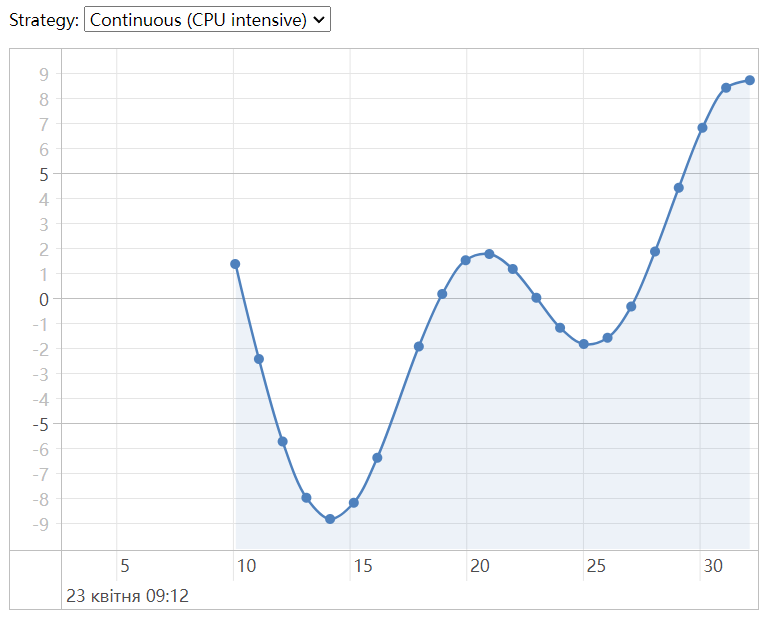
<!doctype html>
<html>
<head>
  <title>Timeline</title>
  <script type="text/javascript" src="https://unpkg.com/vis-timeline@latest/standalone/umd/vis-timeline-graph2d.min.js"></script>
  <script src="https://cdnjs.cloudflare.com/ajax/libs/moment.js/2.29.1/moment.min.js"></script>
  <link href="https://unpkg.com/vis-timeline@latest/styles/vis-timeline-graph2d.min.css" rel="stylesheet" type="text/css" />
  <style type="text/css">
    body,
    html,
    select {
        font: 10pt sans-serif;
    }

    #visualization {
        width: 600px;
    }
  </style>
</head>
<body>
    <p>
        <label for="strategy">Strategy:</label>
        <select id="strategy">
          <option value="continuous" selected="">Continuous (CPU intensive)</option>
          <option value="discrete">Discrete</option>
          <option value="static">Static</option>
        </select>
    </p>
    <div id="visualization"></div>

<script type="text/javascript">
    var DELAY = 1000; // delay in ms to add new data points

    var strategy = document.getElementById("strategy");

    // create a graph2d with an (currently empty) dataset
    var container = document.getElementById("visualization");
    var dataset = new vis.DataSet();

    var options = {
    start: vis.moment().add(-30, "seconds"), // changed so its faster
    end: vis.moment(),
    dataAxis: {
        left: {
        range: {
            min: -10,
            max: 10,
        },
        },
    },
    drawPoints: {
        style: "circle", // square, circle
    },
    shaded: {
        orientation: "bottom", // top, bottom
    },
    };
    var graph2d = new vis.Graph2d(container, dataset, options);

    // a function to generate data points
    function y(x) {
    return (Math.sin(x / 2) + Math.cos(x / 4)) * 5;
    }

    function renderStep() {
    // move the window (you can think of different strategies).
    var now = vis.moment();
    var range = graph2d.getWindow();
    var interval = range.end - range.start;
    switch (strategy.value) {
        case "continuous":
        // continuously move the window
        graph2d.setWindow(now - interval, now, {
            animation: false
        });
        requestAnimationFrame(renderStep);
        break;

        case "discrete":
        graph2d.setWindow(now - interval, now, {
            animation: false
        });
        setTimeout(renderStep, DELAY);
        break;

        default: // 'static'
        // move the window 90% to the left when now is larger than the end of the window
        if (now > range.end) {
            graph2d.setWindow(now - 0.1 * interval, now + 0.9 * interval);
        }
        setTimeout(renderStep, DELAY);
        break;
    }
    }
    renderStep();

    /**
     * Add a new datapoint to the graph
     */
    function addDataPoint() {
    // add a new data point to the dataset
    var now = vis.moment();
    dataset.add({
        x: now,
        y: y(now / 1000),
    });

    // remove all data points which are no longer visible
    var range = graph2d.getWindow();
    var interval = range.end - range.start;
    var oldIds = dataset.getIds({
        filter: function(item) {
        return item.x < range.start - interval;
        },
    });
    dataset.remove(oldIds);

    setTimeout(addDataPoint, DELAY);
    }
    addDataPoint();

</script>
</body>
</html>
点击查看详情


 浙公网安备 33010602011771号