<!doctype html>
<html>
<head>
<title>Timeline</title>
<script type="text/javascript" src="https://unpkg.com/vis-timeline@latest/standalone/umd/vis-timeline-graph2d.min.js"></script>
<script src="https://cdnjs.cloudflare.com/ajax/libs/moment.js/2.29.1/moment.min.js"></script>
<link href="https://unpkg.com/vis-timeline@latest/styles/vis-timeline-graph2d.min.css" rel="stylesheet" type="text/css" />
<style type="text/css">
body,
html {
font-family: sans-serif;
}
.custom-style1 {
fill: #0df200;
fill-opacity: 0;
stroke-width: 2px;
stroke: #0df200;
}
.custom-style2 {
fill: #f23303;
fill-opacity: 0;
stroke-width: 2px;
stroke: #ff0004;
}
#visualization {
width: 600px;
}
</style>
</head>
<body>
<div id="visualization"></div>
<script type="text/javascript">
// create a dataSet with groups
var names = ["Custom1", "Custom2", "Blank", "CircleShaded"];
var groups = new vis.DataSet();
groups.add({
id: 0,
content: names[0],
className: "custom-style1",
options: {
drawPoints: {
style: "square", // square, circle
},
shaded: {
orientation: "bottom", // top, bottom
},
},
});
groups.add({
id: 1,
content: names[1],
className: "custom-style2",
options: {
style: "bar",
drawPoints: { style: "circle", size: 10 },
},
});
groups.add({
id: 2,
content: names[2],
options: {
drawPoints: false,
},
});
groups.add({
id: 3,
content: names[3],
options: {
drawPoints: {
style: "circle", // square, circle
},
shaded: {
orientation: "top", // top, bottom
},
},
});
var container = document.getElementById("visualization");
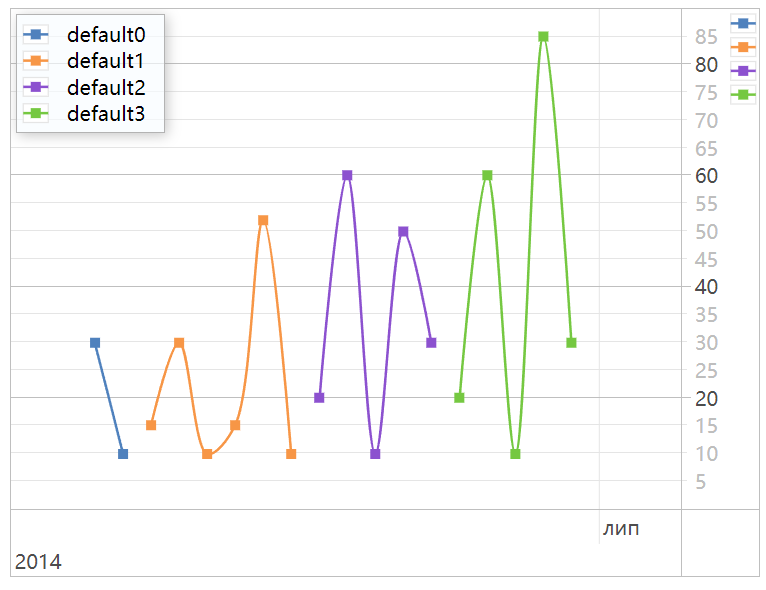
var items = [
{ x: "2014-06-13", y: 30, group: 0 },
{ x: "2014-06-14", y: 10, group: 0 },
{ x: "2014-06-15", y: 15, group: 1 },
{ x: "2014-06-16", y: 30, group: 1 },
{ x: "2014-06-17", y: 10, group: 1 },
{ x: "2014-06-18", y: 15, group: 1 },
{ x: "2014-06-19", y: 52, group: 1 },
{ x: "2014-06-20", y: 10, group: 1 },
{ x: "2014-06-21", y: 20, group: 2 },
{ x: "2014-06-22", y: 60, group: 2 },
{ x: "2014-06-23", y: 10, group: 2 },
{ x: "2014-06-24", y: 50, group: 2 },
{ x: "2014-06-25", y: 30, group: 2 },
{ x: "2014-06-26", y: 20, group: 3 },
{ x: "2014-06-27", y: 60, group: 3 },
{ x: "2014-06-28", y: 10, group: 3 },
{ x: "2014-06-29", y: 85, group: 3 },
{ x: "2014-06-30", y: 30, group: 3 },
];
var dataset = new vis.DataSet(items);
var options = {
legend: { right: { position: "top-left" } },
yAxisOrientation: "right", // right, left
dataAxis: { icons: true },
start: "2014-06-10",
end: "2014-07-04",
moveable: false,
};
var graph2d = new vis.Graph2d(container, dataset, groups, options);
</script>
</body>
</html>
点击查看详情

 浙公网安备 33010602011771号