<!doctype html>
<html>
<head>
<title>Timeline</title>
<script type="text/javascript" src="https://unpkg.com/vis-timeline@latest/standalone/umd/vis-timeline-graph2d.min.js"></script>
<script src="https://cdnjs.cloudflare.com/ajax/libs/moment.js/2.29.1/moment.min.js"></script>
<link href="https://unpkg.com/vis-timeline@latest/styles/vis-timeline-graph2d.min.css" rel="stylesheet" type="text/css" />
<style type="text/css">
body,
html {
font-family: arial, sans-serif;
font-size: 11pt;
}
span.label {
width: 150px;
display: inline-block;
}
#visualization {
width: 600px;
}
</style>
</head>
<body>
<p>
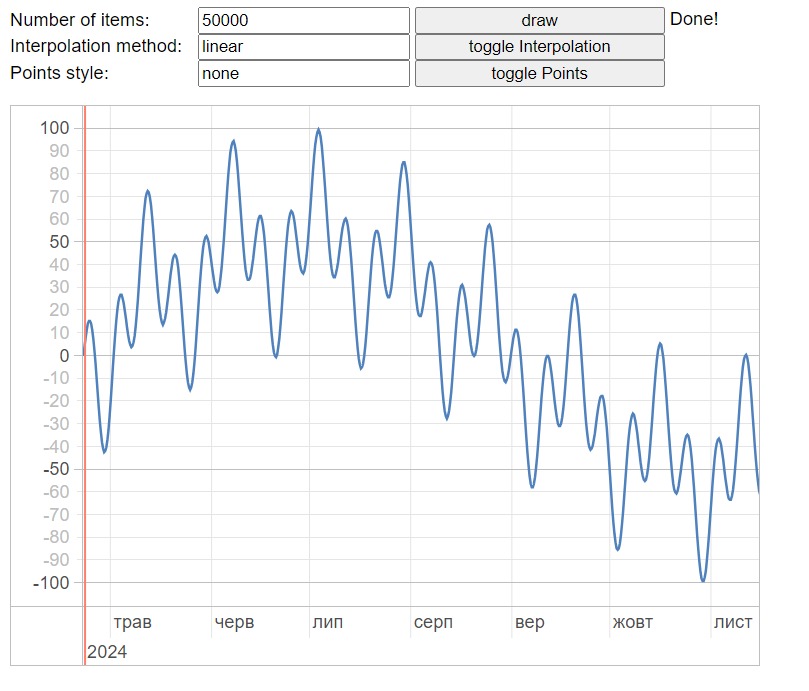
<span class="label">Number of items:</span><input id="count" value="50000" />
<input id="draw" type="button" value="draw" style="width: 200px" />
<span id="description"><b>Click the draw button to load the data!</b></span>
<br />
<span class="label">Interpolation method:</span
><input id="interpolation" value="linear" />
<input
id="toggleInterpolation"
type="button"
value="toggle Interpolation"
style="width: 200px"
/>
<br />
<span class="label">Points style:</span><input id="points" value="none" />
<input
id="togglePoints"
type="button"
value="toggle Points"
style="width: 200px"
/>
</p>
<div id="visualization"></div>
<script type="text/javascript">
var points = "none";
var interpolation = "linear";
function togglePoints() {
var pointsOptions = {};
var pointsField = document.getElementById("points");
if (points == "none") {
points = "circle";
pointsOptions = { drawPoints: { style: points } };
} else if (points == "circle") {
points = "square";
pointsOptions = { drawPoints: { style: points } };
} else if (points == "square") {
points = "none";
pointsOptions = { drawPoints: false };
}
pointsField.value = points;
graph2d.setOptions(pointsOptions);
}
function toggleInterpolation() {
var interpolationOptions = {};
var interpolationField = document.getElementById("interpolation");
if (interpolation == "linear") {
interpolation = "centripetal";
interpolationOptions = {
interpolation: { parametrization: interpolation },
};
} else if (interpolation == "centripetal") {
interpolation = "chordal";
interpolationOptions = {
interpolation: { parametrization: interpolation },
};
} else if (interpolation == "chordal") {
interpolation = "uniform";
interpolationOptions = {
interpolation: { parametrization: interpolation },
};
} else if (interpolation == "uniform") {
interpolation = "linear";
interpolationOptions = { interpolation: false };
}
interpolationField.value = interpolation;
graph2d.setOptions(interpolationOptions);
}
// create a dataset with items
var now = moment().minutes(0).seconds(0).milliseconds(0);
var dataset = new vis.DataSet({
type: { start: "ISODate", end: "ISODate" },
});
var startPoint = now;
var endPoint = now + 3600000 * 5000;
// create data -- this is seperated into 3 functions so we can update the span.
function createData() {
var span = document.getElementById("description");
span.innerHTML = "Generating data... (just javascript, not vis.graph2D)...";
setTimeout(generateData, 10);
}
function generateData() {
var count = parseInt(document.getElementById("count").value) || 100;
var newData = [];
var span = document.getElementById("description");
var start = now;
for (var i = 0; i < count; i++) {
var yval =
Math.sin(i / 100) * Math.cos(i / 50) * 50 + Math.sin(i / 1000) * 50;
newData.push({ id: i, x: start + 3600000 * i, y: yval });
}
span.innerHTML = "Loading data into Graph2d...";
setTimeout(function () {
loadDataIntoVis(newData);
}, 10);
}
function loadDataIntoVis(newData) {
var span = document.getElementById("description");
dataset.clear();
dataset.add(newData);
span.innerHTML = "Done!";
}
document.getElementById("draw").onclick = createData;
document.getElementById("toggleInterpolation").onclick = toggleInterpolation;
document.getElementById("togglePoints").onclick = togglePoints;
var container = document.getElementById("visualization");
var options = {
sampling: true,
drawPoints: { enabled: false, size: 3 },
interpolation: false,
start: startPoint,
end: endPoint,
};
var graph2d = new vis.Graph2d(container, dataset, options);
</script>
</body>
</html>
点击查看详情

 浙公网安备 33010602011771号