<!doctype html>
<html>
<head>
<title>Timeline</title>
<script type="text/javascript" src="https://unpkg.com/vis-timeline@latest/standalone/umd/vis-timeline-graph2d.min.js"></script>
<link href="https://unpkg.com/vis-timeline@latest/styles/vis-timeline-graph2d.min.css" rel="stylesheet" type="text/css" />
<style type="text/css">
body,
html {
font-family: sans-serif;
}
#visualization {
width: 600px;
}
</style>
</head>
<body>
<div id="visualization"></div>
<script type="text/javascript">
// create a dataSet with groups
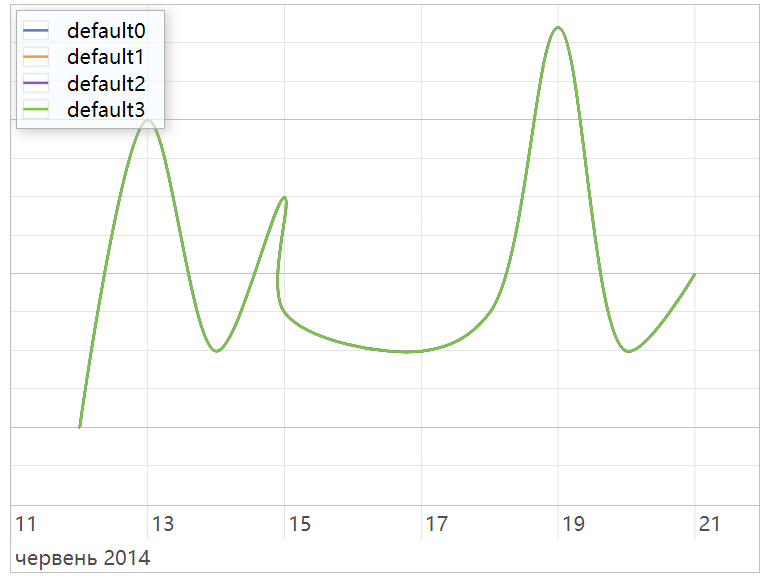
var names = ["centripetal", "chordal", "uniform", "disabled"];
var groups = new vis.DataSet();
groups.add({
id: 0,
content: names[0],
options: {
drawPoints: false,
interpolation: {
parametrization: "centripetal",
},
},
});
groups.add({
id: 1,
content: names[1],
options: {
drawPoints: false,
interpolation: {
parametrization: "chordal",
},
},
});
groups.add({
id: 2,
content: names[2],
options: {
drawPoints: false,
interpolation: {
parametrization: "uniform",
},
},
});
groups.add({
id: 3,
content: names[3],
options: {
drawPoints: { style: "circle" },
interpolation: false,
},
});
var container = document.getElementById("visualization");
var dataset = new vis.DataSet();
for (var i = 0; i < names.length; i++) {
dataset.add([
{ x: "2014-06-12", y: 0, group: i },
{ x: "2014-06-13", y: 40, group: i },
{ x: "2014-06-14", y: 10, group: i },
{ x: "2014-06-15", y: 15, group: i },
{ x: "2014-06-15", y: 30, group: i },
{ x: "2014-06-17", y: 10, group: i },
{ x: "2014-06-18", y: 15, group: i },
{ x: "2014-06-19", y: 52, group: i },
{ x: "2014-06-20", y: 10, group: i },
{ x: "2014-06-21", y: 20, group: i },
]);
}
var options = {
drawPoints: false,
dataAxis: { visible: false },
legend: true,
start: "2014-06-11",
end: "2014-06-22",
};
var graph2d = new vis.Graph2d(container, dataset, groups, options);
</script>
</body>
</html>
点击查看详情

 浙公网安备 33010602011771号