<!doctype html>
<html>
<head>
<title>Timeline</title>
<script type="text/javascript" src="https://unpkg.com/vis-timeline@latest/standalone/umd/vis-timeline-graph2d.min.js"></script>
<link href="https://unpkg.com/vis-timeline@latest/styles/vis-timeline-graph2d.min.css" rel="stylesheet" type="text/css" />
<style type="text/css">
body,
html {
font-family: sans-serif;
}
.red {
fill: red;
}
#visualization {
width: 600px;
}
</style>
</head>
<body>
<div id="visualization"></div>
<script type="text/javascript">
var container = document.getElementById("visualization");
var label1 = {
content: "Label 1 (with offset)",
xOffset: 20,
yOffset: 20,
};
var label2 = {
content: "Label 2",
className: "red",
};
var label3 = {
content: "Label 3",
};
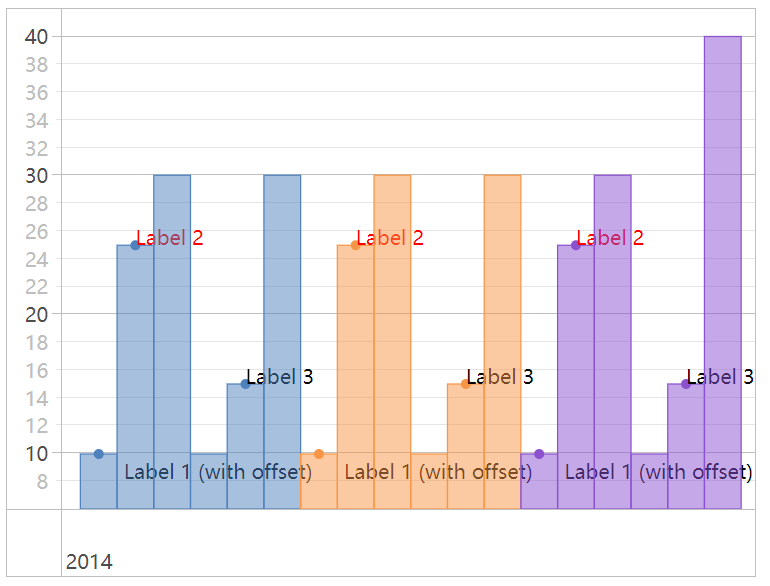
var items = [
{ group: 1, x: "2014-06-11", y: 10, label: label1 },
{ group: 1, x: "2014-06-12", y: 25, label: label2 },
{ group: 1, x: "2014-06-13", y: 30 },
{ group: 1, x: "2014-06-14", y: 10 },
{ group: 1, x: "2014-06-15", y: 15, label: label3 },
{ group: 1, x: "2014-06-16", y: 30 },
{ group: 2, x: "2014-06-17", y: 10, label: label1 },
{ group: 2, x: "2014-06-18", y: 25, label: label2 },
{ group: 2, x: "2014-06-19", y: 30 },
{ group: 2, x: "2014-06-20", y: 10 },
{ group: 2, x: "2014-06-21", y: 15, label: label3 },
{ group: 2, x: "2014-06-22", y: 30 },
{ group: 3, x: "2014-06-23", y: 10, label: label1 },
{ group: 3, x: "2014-06-24", y: 25, label: label2 },
{ group: 3, x: "2014-06-25", y: 30 },
{ group: 3, x: "2014-06-26", y: 10 },
{ group: 3, x: "2014-06-27", y: 15, label: label3 },
{ group: 3, x: "2014-06-28", y: 40 },
];
var groups = new vis.DataSet();
groups.add({
id: 1,
content:
"Only draw items with labels. Make the data point bigger and a square.",
options: {
drawPoints: function group1Renderer(item, group, grap2d) {
if (item.label == null) {
return false;
}
return {
style: "square",
size: 15,
};
},
},
});
groups.add({
id: 2,
content:
"Draw according to the Graph2d callback, but make it every datapoint square one.",
options: {
drawPoints: {
style: "square",
},
},
});
groups.add({
id: 3,
content:
"I want to render datapoints with no labels. Screw the graph2d options. Except the style/size should be according to the graph2d option.",
options: {
drawPoints: function (item, group, grap2d) {
return item.label == null;
},
},
});
var dataset = new vis.DataSet(items);
var options = {
start: "2014-06-10",
end: "2014-06-29",
style: "bar",
drawPoints: {
onRender: function (item, group, grap2d) {
return item.label != null;
},
style: "circle",
},
};
var graph2d = new vis.Graph2d(container, dataset, groups, options);
</script>
</body>
</html>
点击查看详情

 浙公网安备 33010602011771号