<!doctype html>
<html>
<head>
<title>Timeline</title>
<script type="text/javascript" src="https://unpkg.com/vis-timeline@latest/standalone/umd/vis-timeline-graph2d.min.js"></script>
<link href="https://unpkg.com/vis-timeline@latest/styles/vis-timeline-graph2d.min.css" rel="stylesheet" type="text/css" />
<style type="text/css">
body,
html {
font-family: sans-serif;
}
#visualization {
width: 600px;
}
</style>
</head>
<body>
<div id="visualization"></div>
<script type="text/javascript">
var container = document.getElementById("visualization");
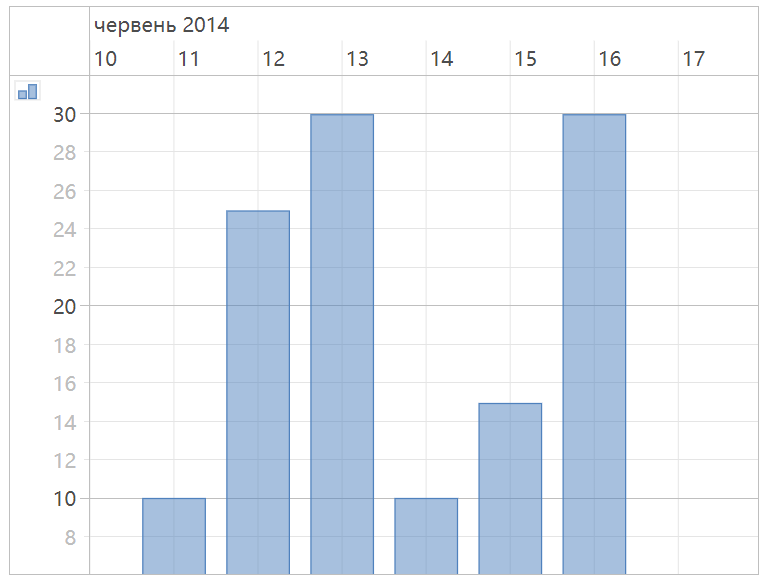
var items = [
{ x: "2014-06-11", y: 10 },
{ x: "2014-06-12", y: 25 },
{ x: "2014-06-13", y: 30 },
{ x: "2014-06-14", y: 10 },
{ x: "2014-06-15", y: 15 },
{ x: "2014-06-16", y: 30 },
];
var dataset = new vis.DataSet(items);
var options = {
style: "bar",
barChart: { width: 50, align: "center" }, // align: left, center, right
drawPoints: false,
dataAxis: {
icons: true,
},
orientation: "top",
start: "2014-06-10", // 打开后默认显示的区间
end: "2014-06-18",
};
var graph2d = new vis.Graph2d(container, items, options);
</script>
</body>
</html>
点击查看详情

 浙公网安备 33010602011771号