<!doctype html>
<html>
<head>
<title>Timeline</title>
<script type="text/javascript" src="https://unpkg.com/vis-timeline@latest/standalone/umd/vis-timeline-graph2d.min.js"></script>
<link href="https://unpkg.com/vis-timeline@latest/styles/vis-timeline-graph2d.min.css" rel="stylesheet" type="text/css" />
<style type="text/css">
body,
html {
font-family: sans-serif;
}
.custom-style1 {
fill: #f2ea00;
fill-opacity: 0;
stroke-width: 2px;
stroke: #b3ab00;
}
.custom-style2 {
fill: #00a0f2;
fill-opacity: 0;
stroke-width: 2px;
stroke: #050092;
}
.custom-style3 {
fill: #00f201;
fill-opacity: 0;
stroke-width: 2px;
stroke: #029200;
}
path.custom-style3.vis-fill {
fill-opacity: 0.5 !important;
stroke: none;
}
/*宽度*/
#visualization {
width: 600px;
}
.div1 {
position: relative;
top: 10px;
}
</style>
</head>
<body>
<div id="visualization"></div>
<div style="width: 800px; font-size: 14px; text-align: justify" class="div1">
<table>
<tbody>
<tr>
<td>
<input
type="button"
onclick="showIcons(true)"
value="Show Icons"
/>
</td>
<td>
<input
type="button"
onclick="showIcons(false)"
value="Hide Icons"
/>
</td>
</tr>
<tr>
<td>
<input
type="button"
onclick="showTitle('left', true)"
value="Show Left Title"
/>
</td>
<td>
<input
type="button"
onclick="showTitle('left', false)"
value="Hide Left Title"
/>
</td>
</tr>
<tr>
<td>
<input
type="button"
onclick="showTitle('right', true)"
value="Show Right Title"
/>
</td>
<td>
<input
type="button"
onclick="showTitle('right', false)"
value="Hide Right Title"
/>
</td>
</tr>
<tr>
<td>
<input
type="button"
onclick="styleTitle('left')"
value="Color Left Title"
/>
</td>
<td>
<input
type="button"
onclick="styleTitle('right')"
value="Color Right Title"
/>
</td>
</tr>
</tbody>
</table>
</div>
<script type="text/javascript">
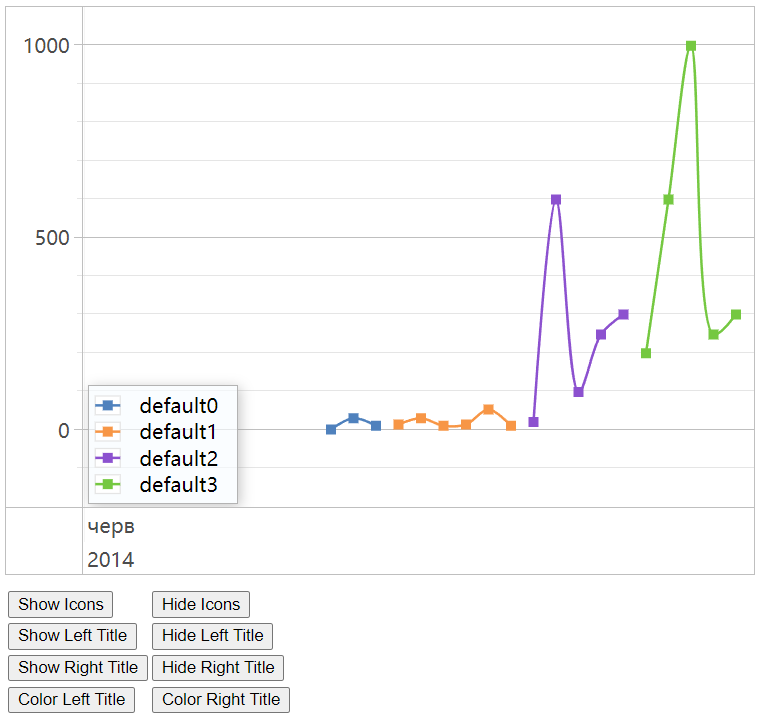
var names = ["SquareShaded", "Bargraph", "Blank", "CircleShaded"];
var groups = new vis.DataSet();
groups.add({
id: 0,
content: names[0],
className: "custom-style1",
options: {
drawPoints: {
style: "square", // square, circle
},
shaded: {
orientation: "bottom", // top, bottom
},
},
});
groups.add({
id: 1,
content: names[1],
className: "custom-style2",
options: {
style: "bar",
drawPoints: { style: "circle", size: 10 },
},
});
groups.add({
id: 2,
content: names[2],
options: {
yAxisOrientation: "right", // right, left
drawPoints: false,
},
});
groups.add({
id: 3,
content: names[3],
className: "custom-style3",
options: {
yAxisOrientation: "right", // right, left
drawPoints: {
style: "circle", // square, circle
},
shaded: {
orientation: "top", // top, bottom
},
},
});
var container = document.getElementById("visualization");
var items = [
{ x: "2014-06-12", y: 0, group: 0 },
{ x: "2014-06-13", y: 30, group: 0 },
{ x: "2014-06-14", y: 10, group: 0 },
{ x: "2014-06-15", y: 15, group: 1 },
{ x: "2014-06-16", y: 30, group: 1 },
{ x: "2014-06-17", y: 10, group: 1 },
{ x: "2014-06-18", y: 15, group: 1 },
{ x: "2014-06-19", y: 52, group: 1 },
{ x: "2014-06-20", y: 10, group: 1 },
{ x: "2014-06-21", y: 20, group: 2 },
{ x: "2014-06-22", y: 600, group: 2 },
{ x: "2014-06-23", y: 100, group: 2 },
{ x: "2014-06-24", y: 250, group: 2 },
{ x: "2014-06-25", y: 300, group: 2 },
{ x: "2014-06-26", y: 200, group: 3 },
{ x: "2014-06-27", y: 600, group: 3 },
{ x: "2014-06-28", y: 1000, group: 3 },
{ x: "2014-06-29", y: 250, group: 3 },
{ x: "2014-06-30", y: 300, group: 3 },
];
var dataset = new vis.DataSet(items);
var options = {
dataAxis: {
showMinorLabels: false,
right: {
title: {
text: "Title (right axis)",
},
},
},
legend: { left: { position: "bottom-left" } },
start: "2014-06-01", // 打开后默认显示的区间
end: "2014-07-01",
};
var graph2d = new vis.Graph2d(container, items, groups, options);
function showIcons(show) {
graph2d.setOptions({ dataAxis: { icons: show } });
}
function showTitle(axis, show) {
var title;
if (show == true) {
title = { text: "Title (" + axis + " axis)" };
} else {
title = { text: undefined };
}
if (axis == "left") {
graph2d.setOptions({ dataAxis: { left: { title: title } } });
} else {
graph2d.setOptions({ dataAxis: { right: { title: title } } });
}
}
var colors = ["red", "green", "blue", "black", "yellow", "purple", "pink"];
function styleTitle(axis) {
var title;
title = {
style: "color: " + colors[Math.floor(Math.random() * colors.length) + 1],
};
if (axis == "left") {
graph2d.setOptions({ dataAxis: { left: { title: title } } });
} else {
graph2d.setOptions({ dataAxis: { right: { title: title } } });
}
}
</script>
</body>
</html>
点击查看详情

 浙公网安备 33010602011771号