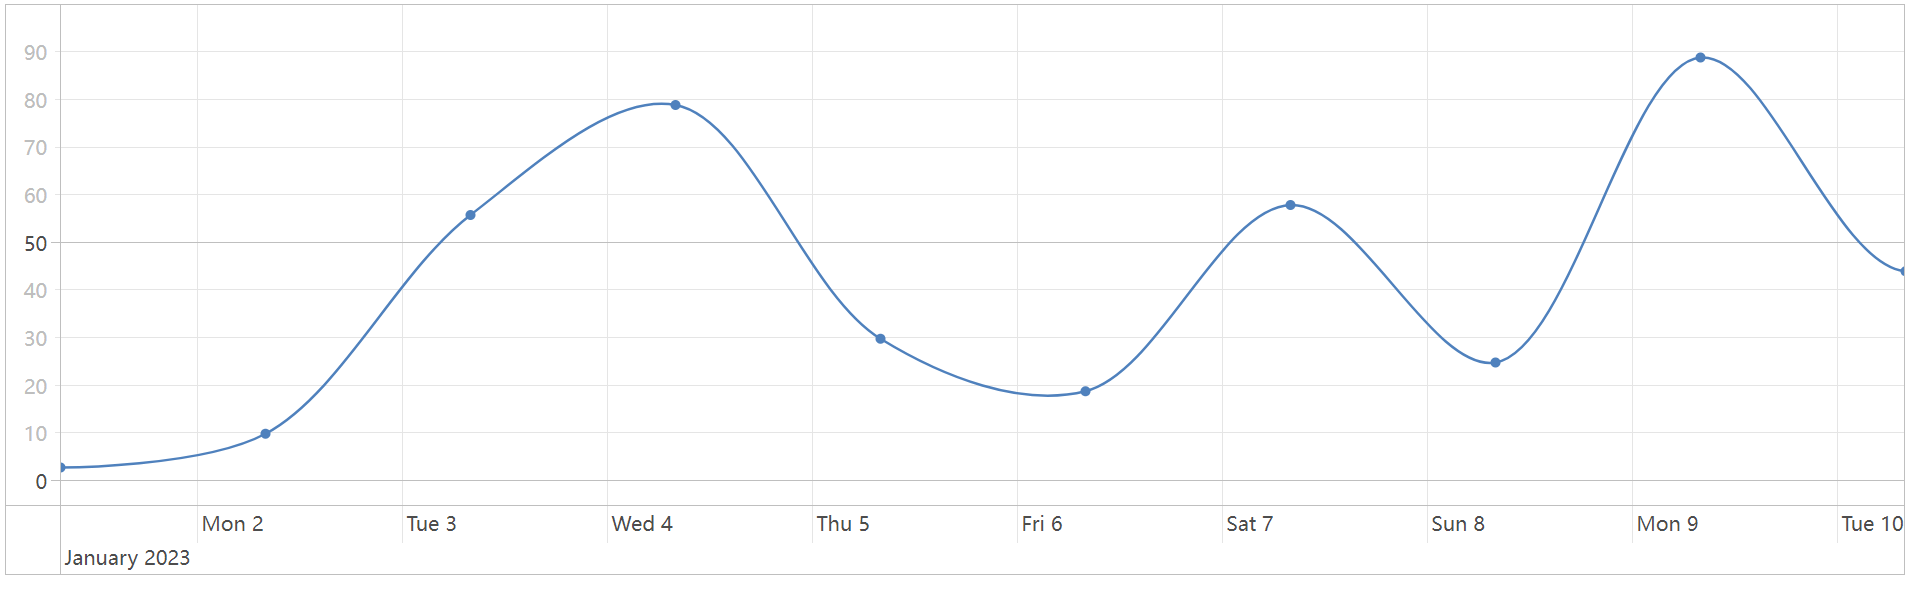
案例1
<!DOCTYPE html>
<html lang="en">
<head>
    <meta charset="UTF-8">
    <meta name="viewport" content="width=device-width, initial-scale=1.0">
    <title>vis.js 折线图</title>
    <!-- 引入 vis.js 库 -->
    <script src="https://cdnjs.cloudflare.com/ajax/libs/vis/4.21.0/vis.min.js"></script>
    <link rel="stylesheet" type="text/css" href="https://cdnjs.cloudflare.com/ajax/libs/vis/4.21.0/vis.min.css">
</head>
<body>

<div id="visualization"></div>

<script>
    // 准备数据
    var items = [
        {x: '2023-01-01', y: 3},
        {x: '2023-01-02', y: 10},
        {x: '2023-01-03', y: 56},
        {x: '2023-01-04', y: 79},
        {x: '2023-01-05', y: 30},
        {x: '2023-01-06', y: 19},
        {x: '2023-01-07', y: 58},
        {x: '2023-01-08', y: 25},
        {x: '2023-01-09', y: 89},
        {x: '2023-01-10', y: 44},
        {x: '2023-01-11', y: 77},
        {x: '2023-01-12', y: 15},
        {x: '2023-01-13', y: 85},
        {x: '2023-01-14', y: 18},
        {x: '2023-01-15', y: 95},
        {x: '2023-01-16', y: 26},
        {x: '2023-01-17', y: 35},
        {x: '2023-01-17', y: 59},
        {x: '2023-01-19', y: 85},
        {x: '2023-01-20', y: 48},
        {x: '2023-01-21', y: 95},
    ];

    var dataset = new vis.DataSet(items);

    // 创建折线图
    var options = {
        start: '2023-01-01',
        end: '2023-01-10',
        drawPoints: {
            style: 'circle'
        },
        dataAxis: {
            showGrid: true,
            showMinorLabels: true
        }
    };

    var graph2d = new vis.Graph2d(document.getElementById('visualization'), dataset, null, options);
</script>

</body>
</html>
点击查看详情
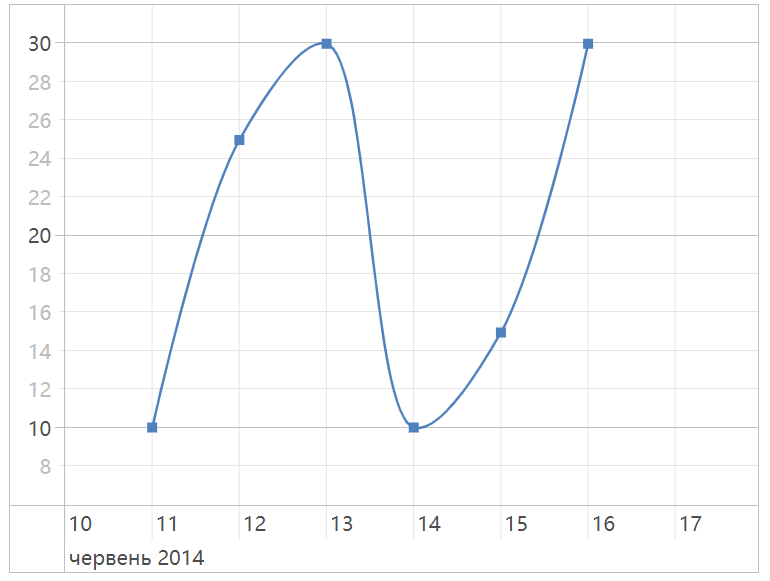
案例2
<!doctype html>
<html>
<head>
  <title>Timeline</title>
  <script type="text/javascript" src="https://unpkg.com/vis-timeline@latest/standalone/umd/vis-timeline-graph2d.min.js"></script>
  <link href="https://unpkg.com/vis-timeline@latest/styles/vis-timeline-graph2d.min.css" rel="stylesheet" type="text/css" />
  <style type="text/css">
    body,
    html {
        font-family: sans-serif;
    }
    #visualization {
        width: 600px;
    }
  </style>
</head>
<body>
    <div id="visualization"></div>

<script type="text/javascript">
    var container = document.getElementById("visualization");
    var items = [
    { x: "2014-06-11", y: 10 },
    { x: "2014-06-12", y: 25 },
    { x: "2014-06-13", y: 30 },
    { x: "2014-06-14", y: 10 },
    { x: "2014-06-15", y: 15 },
    { x: "2014-06-16", y: 30 },
    ];

    var dataset = new vis.DataSet(items);
    var options = {
    start: "2014-06-10",
    end: "2014-06-18",
    };
    var graph2d = new vis.Graph2d(container, dataset, options);

</script>
</body>
</html>
点击查看详情

 浙公网安备 33010602011771号