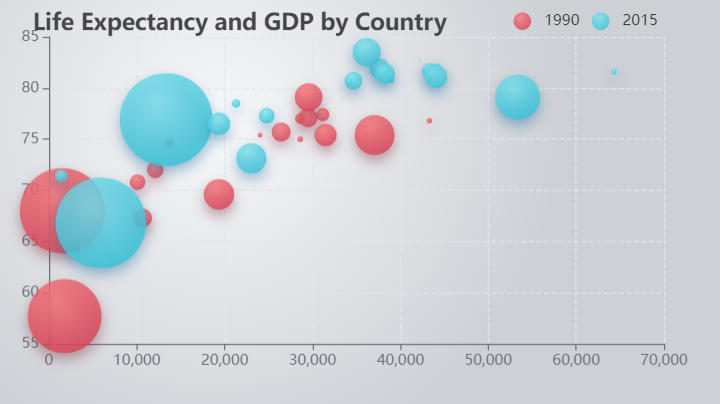
案例1
<!--
	此示例下载自 https://echarts.apache.org/examples/zh/editor.html?c=bubble-gradient
-->
<!DOCTYPE html>
<html lang="en" style="height: 100%">
<head>
  <meta charset="utf-8">
</head>
<body style="height: 100%; margin: 0">
  <div id="container" style="width: 600px;height: 350px"></div>

  <script type="text/javascript" src="https://registry.npmmirror.com/echarts/5.5.0/files/dist/echarts.min.js"></script>
  <!-- Uncomment this line if you want to dataTool extension
  <script type="text/javascript" src="https://registry.npmmirror.com/echarts/5.5.0/files/dist/extension/dataTool.min.js"></script>
  -->
  <!-- Uncomment this line if you want to use gl extension
  <script type="text/javascript" src="https://registry.npmmirror.com/echarts-gl/2/files/dist/echarts-gl.min.js"></script>
  -->
  <!-- Uncomment this line if you want to echarts-stat extension
  <script type="text/javascript" src="https://registry.npmmirror.com/echarts-stat/latest/files/dist/ecStat.min.js"></script>
  -->
  <!-- Uncomment this line if you want to use map
  <script type="text/javascript" src="https://registry.npmmirror.com/echarts/4.9.0/files/map/js/china.js"></script>
  <script type="text/javascript" src="https://registry.npmmirror.com/echarts/4.9.0/files/map/js/world.js"></script>
  -->
  <!-- Uncomment these two lines if you want to use bmap extension
  <script type="text/javascript" src="https://api.map.baidu.com/api?v=3.0&ak=YOUR_API_KEY"></script>
  <script type="text/javascript" src="https://registry.npmmirror.com/echarts/5.5.0/files/dist/extension/bmap.min.js"></script>
  -->

  <script type="text/javascript">
    var dom = document.getElementById('container');
    var myChart = echarts.init(dom, null, {
      renderer: 'canvas',
      useDirtyRect: false
    });
    var app = {};

    var option;

    const data = [
  [
    [28604, 77, 17096869, 'Australia', 1990],
    [31163, 77.4, 27662440, 'Canada', 1990],
    [1516, 68, 1154605773, 'China', 1990],
    [13670, 74.7, 10582082, 'Cuba', 1990],
    [28599, 75, 4986705, 'Finland', 1990],
    [29476, 77.1, 56943299, 'France', 1990],
    [31476, 75.4, 78958237, 'Germany', 1990],
    [28666, 78.1, 254830, 'Iceland', 1990],
    [1777, 57.7, 870601776, 'India', 1990],
    [29550, 79.1, 122249285, 'Japan', 1990],
    [2076, 67.9, 20194354, 'North Korea', 1990],
    [12087, 72, 42972254, 'South Korea', 1990],
    [24021, 75.4, 3397534, 'New Zealand', 1990],
    [43296, 76.8, 4240375, 'Norway', 1990],
    [10088, 70.8, 38195258, 'Poland', 1990],
    [19349, 69.6, 147568552, 'Russia', 1990],
    [10670, 67.3, 53994605, 'Turkey', 1990],
    [26424, 75.7, 57110117, 'United Kingdom', 1990],
    [37062, 75.4, 252847810, 'United States', 1990]
  ],
  [
    [44056, 81.8, 23968973, 'Australia', 2015],
    [43294, 81.7, 35939927, 'Canada', 2015],
    [13334, 76.9, 1376048943, 'China', 2015],
    [21291, 78.5, 11389562, 'Cuba', 2015],
    [38923, 80.8, 5503457, 'Finland', 2015],
    [37599, 81.9, 64395345, 'France', 2015],
    [44053, 81.1, 80688545, 'Germany', 2015],
    [42182, 82.8, 329425, 'Iceland', 2015],
    [5903, 66.8, 1311050527, 'India', 2015],
    [36162, 83.5, 126573481, 'Japan', 2015],
    [1390, 71.4, 25155317, 'North Korea', 2015],
    [34644, 80.7, 50293439, 'South Korea', 2015],
    [34186, 80.6, 4528526, 'New Zealand', 2015],
    [64304, 81.6, 5210967, 'Norway', 2015],
    [24787, 77.3, 38611794, 'Poland', 2015],
    [23038, 73.13, 143456918, 'Russia', 2015],
    [19360, 76.5, 78665830, 'Turkey', 2015],
    [38225, 81.4, 64715810, 'United Kingdom', 2015],
    [53354, 79.1, 321773631, 'United States', 2015]
  ]
];
option = {
  backgroundColor: new echarts.graphic.RadialGradient(0.3, 0.3, 0.8, [
    {
      offset: 0,
      color: '#f7f8fa'
    },
    {
      offset: 1,
      color: '#cdd0d5'
    }
  ]),
  title: {
    text: 'Life Expectancy and GDP by Country',
    left: '5%',
    top: '3%'
  },
  legend: {
    right: '10%',
    top: '3%',
    data: ['1990', '2015']
  },
  grid: {
    left: '8%',
    top: '10%'
  },
  xAxis: {
    splitLine: {
      lineStyle: {
        type: 'dashed'
      }
    }
  },
  yAxis: {
    splitLine: {
      lineStyle: {
        type: 'dashed'
      }
    },
    scale: true
  },
  series: [
    {
      name: '1990',
      data: data[0],
      type: 'scatter',
      symbolSize: function (data) {
        return Math.sqrt(data[2]) / 5e2;
      },
      emphasis: {
        focus: 'series',
        label: {
          show: true,
          formatter: function (param) {
            return param.data[3];
          },
          position: 'top'
        }
      },
      itemStyle: {
        shadowBlur: 10,
        shadowColor: 'rgba(120, 36, 50, 0.5)',
        shadowOffsetY: 5,
        color: new echarts.graphic.RadialGradient(0.4, 0.3, 1, [
          {
            offset: 0,
            color: 'rgb(251, 118, 123)'
          },
          {
            offset: 1,
            color: 'rgb(204, 46, 72)'
          }
        ])
      }
    },
    {
      name: '2015',
      data: data[1],
      type: 'scatter',
      symbolSize: function (data) {
        return Math.sqrt(data[2]) / 5e2;
      },
      emphasis: {
        focus: 'series',
        label: {
          show: true,
          formatter: function (param) {
            return param.data[3];
          },
          position: 'top'
        }
      },
      itemStyle: {
        shadowBlur: 10,
        shadowColor: 'rgba(25, 100, 150, 0.5)',
        shadowOffsetY: 5,
        color: new echarts.graphic.RadialGradient(0.4, 0.3, 1, [
          {
            offset: 0,
            color: 'rgb(129, 227, 238)'
          },
          {
            offset: 1,
            color: 'rgb(25, 183, 207)'
          }
        ])
      }
    }
  ]
};

    if (option && typeof option === 'object') {
      myChart.setOption(option);
    }

    window.addEventListener('resize', myChart.resize);
  </script>
</body>
</html>
- 效果图
案例2
<!--
	此示例下载自 https://echarts.apache.org/examples/zh/editor.html?c=scatter-aqi-color
-->
<!DOCTYPE html>
<html lang="en" style="height: 100%">
<head>
  <meta charset="utf-8">
</head>
<body style="height: 100%; margin: 0">
  <div id="container" style="width: 600px;height: 350px"></div>

  <script type="text/javascript" src="https://registry.npmmirror.com/echarts/5.5.0/files/dist/echarts.min.js"></script>
  <!-- Uncomment this line if you want to dataTool extension
  <script type="text/javascript" src="https://registry.npmmirror.com/echarts/5.5.0/files/dist/extension/dataTool.min.js"></script>
  -->
  <!-- Uncomment this line if you want to use gl extension
  <script type="text/javascript" src="https://registry.npmmirror.com/echarts-gl/2/files/dist/echarts-gl.min.js"></script>
  -->
  <!-- Uncomment this line if you want to echarts-stat extension
  <script type="text/javascript" src="https://registry.npmmirror.com/echarts-stat/latest/files/dist/ecStat.min.js"></script>
  -->
  <!-- Uncomment this line if you want to use map
  <script type="text/javascript" src="https://registry.npmmirror.com/echarts/4.9.0/files/map/js/china.js"></script>
  <script type="text/javascript" src="https://registry.npmmirror.com/echarts/4.9.0/files/map/js/world.js"></script>
  -->
  <!-- Uncomment these two lines if you want to use bmap extension
  <script type="text/javascript" src="https://api.map.baidu.com/api?v=3.0&ak=YOUR_API_KEY"></script>
  <script type="text/javascript" src="https://registry.npmmirror.com/echarts/5.5.0/files/dist/extension/bmap.min.js"></script>
  -->

  <script type="text/javascript">
    var dom = document.getElementById('container');
    var myChart = echarts.init(dom, null, {
      renderer: 'canvas',
      useDirtyRect: false
    });
    var app = {};

    var option;

    const dataBJ = [
  [1, 55, 9, 56, 0.46, 18, 6, '良'],
  [2, 25, 11, 21, 0.65, 34, 9, '优'],
  [3, 56, 7, 63, 0.3, 14, 5, '良'],
  [4, 33, 7, 29, 0.33, 16, 6, '优'],
  [5, 42, 24, 44, 0.76, 40, 16, '优'],
  [6, 82, 58, 90, 1.77, 68, 33, '良'],
  [7, 74, 49, 77, 1.46, 48, 27, '良'],
  [8, 78, 55, 80, 1.29, 59, 29, '良'],
  [9, 267, 216, 280, 4.8, 108, 64, '重度污染'],
  [10, 185, 127, 216, 2.52, 61, 27, '中度污染'],
  [11, 39, 19, 38, 0.57, 31, 15, '优'],
  [12, 41, 11, 40, 0.43, 21, 7, '优'],
  [13, 64, 38, 74, 1.04, 46, 22, '良'],
  [14, 108, 79, 120, 1.7, 75, 41, '轻度污染'],
  [15, 108, 63, 116, 1.48, 44, 26, '轻度污染'],
  [16, 33, 6, 29, 0.34, 13, 5, '优'],
  [17, 94, 66, 110, 1.54, 62, 31, '良'],
  [18, 186, 142, 192, 3.88, 93, 79, '中度污染'],
  [19, 57, 31, 54, 0.96, 32, 14, '良'],
  [20, 22, 8, 17, 0.48, 23, 10, '优'],
  [21, 39, 15, 36, 0.61, 29, 13, '优'],
  [22, 94, 69, 114, 2.08, 73, 39, '良'],
  [23, 99, 73, 110, 2.43, 76, 48, '良'],
  [24, 31, 12, 30, 0.5, 32, 16, '优'],
  [25, 42, 27, 43, 1, 53, 22, '优'],
  [26, 154, 117, 157, 3.05, 92, 58, '中度污染'],
  [27, 234, 185, 230, 4.09, 123, 69, '重度污染'],
  [28, 160, 120, 186, 2.77, 91, 50, '中度污染'],
  [29, 134, 96, 165, 2.76, 83, 41, '轻度污染'],
  [30, 52, 24, 60, 1.03, 50, 21, '良'],
  [31, 46, 5, 49, 0.28, 10, 6, '优']
];
const dataGZ = [
  [1, 26, 37, 27, 1.163, 27, 13, '优'],
  [2, 85, 62, 71, 1.195, 60, 8, '良'],
  [3, 78, 38, 74, 1.363, 37, 7, '良'],
  [4, 21, 21, 36, 0.634, 40, 9, '优'],
  [5, 41, 42, 46, 0.915, 81, 13, '优'],
  [6, 56, 52, 69, 1.067, 92, 16, '良'],
  [7, 64, 30, 28, 0.924, 51, 2, '良'],
  [8, 55, 48, 74, 1.236, 75, 26, '良'],
  [9, 76, 85, 113, 1.237, 114, 27, '良'],
  [10, 91, 81, 104, 1.041, 56, 40, '良'],
  [11, 84, 39, 60, 0.964, 25, 11, '良'],
  [12, 64, 51, 101, 0.862, 58, 23, '良'],
  [13, 70, 69, 120, 1.198, 65, 36, '良'],
  [14, 77, 105, 178, 2.549, 64, 16, '良'],
  [15, 109, 68, 87, 0.996, 74, 29, '轻度污染'],
  [16, 73, 68, 97, 0.905, 51, 34, '良'],
  [17, 54, 27, 47, 0.592, 53, 12, '良'],
  [18, 51, 61, 97, 0.811, 65, 19, '良'],
  [19, 91, 71, 121, 1.374, 43, 18, '良'],
  [20, 73, 102, 182, 2.787, 44, 19, '良'],
  [21, 73, 50, 76, 0.717, 31, 20, '良'],
  [22, 84, 94, 140, 2.238, 68, 18, '良'],
  [23, 93, 77, 104, 1.165, 53, 7, '良'],
  [24, 99, 130, 227, 3.97, 55, 15, '良'],
  [25, 146, 84, 139, 1.094, 40, 17, '轻度污染'],
  [26, 113, 108, 137, 1.481, 48, 15, '轻度污染'],
  [27, 81, 48, 62, 1.619, 26, 3, '良'],
  [28, 56, 48, 68, 1.336, 37, 9, '良'],
  [29, 82, 92, 174, 3.29, 0, 13, '良'],
  [30, 106, 116, 188, 3.628, 101, 16, '轻度污染'],
  [31, 118, 50, 0, 1.383, 76, 11, '轻度污染']
];
const dataSH = [
  [1, 91, 45, 125, 0.82, 34, 23, '良'],
  [2, 65, 27, 78, 0.86, 45, 29, '良'],
  [3, 83, 60, 84, 1.09, 73, 27, '良'],
  [4, 109, 81, 121, 1.28, 68, 51, '轻度污染'],
  [5, 106, 77, 114, 1.07, 55, 51, '轻度污染'],
  [6, 109, 81, 121, 1.28, 68, 51, '轻度污染'],
  [7, 106, 77, 114, 1.07, 55, 51, '轻度污染'],
  [8, 89, 65, 78, 0.86, 51, 26, '良'],
  [9, 53, 33, 47, 0.64, 50, 17, '良'],
  [10, 80, 55, 80, 1.01, 75, 24, '良'],
  [11, 117, 81, 124, 1.03, 45, 24, '轻度污染'],
  [12, 99, 71, 142, 1.1, 62, 42, '良'],
  [13, 95, 69, 130, 1.28, 74, 50, '良'],
  [14, 116, 87, 131, 1.47, 84, 40, '轻度污染'],
  [15, 108, 80, 121, 1.3, 85, 37, '轻度污染'],
  [16, 134, 83, 167, 1.16, 57, 43, '轻度污染'],
  [17, 79, 43, 107, 1.05, 59, 37, '良'],
  [18, 71, 46, 89, 0.86, 64, 25, '良'],
  [19, 97, 71, 113, 1.17, 88, 31, '良'],
  [20, 84, 57, 91, 0.85, 55, 31, '良'],
  [21, 87, 63, 101, 0.9, 56, 41, '良'],
  [22, 104, 77, 119, 1.09, 73, 48, '轻度污染'],
  [23, 87, 62, 100, 1, 72, 28, '良'],
  [24, 168, 128, 172, 1.49, 97, 56, '中度污染'],
  [25, 65, 45, 51, 0.74, 39, 17, '良'],
  [26, 39, 24, 38, 0.61, 47, 17, '优'],
  [27, 39, 24, 39, 0.59, 50, 19, '优'],
  [28, 93, 68, 96, 1.05, 79, 29, '良'],
  [29, 188, 143, 197, 1.66, 99, 51, '中度污染'],
  [30, 174, 131, 174, 1.55, 108, 50, '中度污染'],
  [31, 187, 143, 201, 1.39, 89, 53, '中度污染']
];
const schema = [
  { name: 'date', index: 0, text: '日' },
  { name: 'AQIindex', index: 1, text: 'AQI指数' },
  { name: 'PM25', index: 2, text: 'PM2.5' },
  { name: 'PM10', index: 3, text: 'PM10' },
  { name: 'CO', index: 4, text: '一氧化碳(CO)' },
  { name: 'NO2', index: 5, text: '二氧化氮(NO2)' },
  { name: 'SO2', index: 6, text: '二氧化硫(SO2)' }
];
const itemStyle = {
  opacity: 0.8,
  shadowBlur: 10,
  shadowOffsetX: 0,
  shadowOffsetY: 0,
  shadowColor: 'rgba(0,0,0,0.3)'
};
option = {
  color: ['#dd4444', '#fec42c', '#80F1BE'],
  legend: {
    top: 10,
    data: ['北京', '上海', '广州'],
    textStyle: {
      fontSize: 16
    }
  },
  grid: {
    left: '10%',
    right: 150,
    top: '18%',
    bottom: '10%'
  },
  tooltip: {
    backgroundColor: 'rgba(255,255,255,0.7)',
    formatter: function (param) {
      var value = param.value;
      // prettier-ignore
      return '<div style="border-bottom: 1px solid rgba(255,255,255,.3); font-size: 18px;padding-bottom: 7px;margin-bottom: 7px">'
                + param.seriesName + ' ' + value[0] + '日:'
                + value[7]
                + '</div>'
                + schema[1].text + ':' + value[1] + '<br>'
                + schema[2].text + ':' + value[2] + '<br>'
                + schema[3].text + ':' + value[3] + '<br>'
                + schema[4].text + ':' + value[4] + '<br>'
                + schema[5].text + ':' + value[5] + '<br>'
                + schema[6].text + ':' + value[6] + '<br>';
    }
  },
  xAxis: {
    type: 'value',
    name: '日期',
    nameGap: 16,
    nameTextStyle: {
      fontSize: 16
    },
    max: 31,
    splitLine: {
      show: false
    }
  },
  yAxis: {
    type: 'value',
    name: 'AQI指数',
    nameLocation: 'end',
    nameGap: 20,
    nameTextStyle: {
      fontSize: 16
    },
    splitLine: {
      show: false
    }
  },
  visualMap: [
    {
      left: 'right',
      top: '10%',
      dimension: 2,
      min: 0,
      max: 250,
      itemWidth: 30,
      itemHeight: 120,
      calculable: true,
      precision: 0.1,
      text: ['圆形大小:PM2.5'],
      textGap: 30,
      inRange: {
        symbolSize: [10, 70]
      },
      outOfRange: {
        symbolSize: [10, 70],
        color: ['rgba(255,255,255,0.4)']
      },
      controller: {
        inRange: {
          color: ['#c23531']
        },
        outOfRange: {
          color: ['#999']
        }
      }
    },
    {
      left: 'right',
      bottom: '5%',
      dimension: 6,
      min: 0,
      max: 50,
      itemHeight: 120,
      text: ['明暗:二氧化硫'],
      textGap: 30,
      inRange: {
        colorLightness: [0.9, 0.5]
      },
      outOfRange: {
        color: ['rgba(255,255,255,0.4)']
      },
      controller: {
        inRange: {
          color: ['#c23531']
        },
        outOfRange: {
          color: ['#999']
        }
      }
    }
  ],
  series: [
    {
      name: '北京',
      type: 'scatter',
      itemStyle: itemStyle,
      data: dataBJ
    },
    {
      name: '上海',
      type: 'scatter',
      itemStyle: itemStyle,
      data: dataSH
    },
    {
      name: '广州',
      type: 'scatter',
      itemStyle: itemStyle,
      data: dataGZ
    }
  ]
};

    if (option && typeof option === 'object') {
      myChart.setOption(option);
    }

    window.addEventListener('resize', myChart.resize);
  </script>
</body>
</html>
- 效果图

案例3
点击查看代码
[
    [
        "Beverage, instant breakfast powder, chocolate, not reconstituted",
        "Dairy and Egg Products",
        19.9,
        0.285,
        0.385,
        0.4,
        0.07690000000000001,
        0.947,
        66.2,
        65.8,
        1.4,
        7.4,
        357,
        0.56,
        0.314,
        0.278,
        27481
    ],
    [
        "Beverage, instant breakfast powder, chocolate, sugar-free, not reconstituted",
        "Dairy and Egg Products",
        35.8,
        0.5,
        0.717,
        2,
        0.138,
        1.705,
        41,
        39,
        5.1,
        7.4,
        358,
        2.162,
        1.189,
        1.027,
        27482
    ],
    [
        "Beverage, milkshake mix, dry, not chocolate",
        "Dairy and Egg Products",
        23.5,
        0.88,
        0.78,
        1.6,
        0.0012,
        2.2,
        52.9,
        51.3,
        2.6,
        12.8,
        329,
        2.059,
        0.332,
        0.06,
        27483
    ]
]
<!--
	此示例下载自 https://echarts.apache.org/examples/zh/editor.html?c=scatter-nutrients
-->
<!DOCTYPE html>
<html lang="en" style="height: 100%">
<head>
  <meta charset="utf-8">
</head>
<body style="height: 100%; margin: 0">
  <div id="container" style="width: 600px;height: 350px"></div>

  <script type="text/javascript" src="https://cdn.staticfile.org/jquery/3.7.1/jquery.min.js"></script>
  <script type="text/javascript" src="https://registry.npmmirror.com/echarts/5.5.0/files/dist/echarts.min.js"></script>
  <!-- Uncomment this line if you want to dataTool extension
  <script type="text/javascript" src="https://registry.npmmirror.com/echarts/5.5.0/files/dist/extension/dataTool.min.js"></script>
  -->
  <!-- Uncomment this line if you want to use gl extension
  <script type="text/javascript" src="https://registry.npmmirror.com/echarts-gl/2/files/dist/echarts-gl.min.js"></script>
  -->
  <!-- Uncomment this line if you want to echarts-stat extension
  <script type="text/javascript" src="https://registry.npmmirror.com/echarts-stat/latest/files/dist/ecStat.min.js"></script>
  -->
  <!-- Uncomment this line if you want to use map
  <script type="text/javascript" src="https://registry.npmmirror.com/echarts/4.9.0/files/map/js/china.js"></script>
  <script type="text/javascript" src="https://registry.npmmirror.com/echarts/4.9.0/files/map/js/world.js"></script>
  -->
  <!-- Uncomment these two lines if you want to use bmap extension
  <script type="text/javascript" src="https://api.map.baidu.com/api?v=3.0&ak=YOUR_API_KEY"></script>
  <script type="text/javascript" src="https://registry.npmmirror.com/echarts/5.5.0/files/dist/extension/bmap.min.js"></script>
  -->

  <script type="text/javascript">
    var dom = document.getElementById('container');
    var myChart = echarts.init(dom, null, {
      renderer: 'canvas',
      useDirtyRect: false
    });
    var app = {};
    // var ROOT_PATH = 'https://echarts.apache.org/examples';
    var option;

    const indices = {
  name: 0,
  group: 1,
  id: 16
};
const schema = [
  { name: 'name', index: 0 },
  { name: 'group', index: 1 },
  { name: 'protein', index: 2 },
  { name: 'calcium', index: 3 },
  { name: 'sodium', index: 4 },
  { name: 'fiber', index: 5 },
  { name: 'vitaminc', index: 6 },
  { name: 'potassium', index: 7 },
  { name: 'carbohydrate', index: 8 },
  { name: 'sugars', index: 9 },
  { name: 'fat', index: 10 },
  { name: 'water', index: 11 },
  { name: 'calories', index: 12 },
  { name: 'saturated', index: 13 },
  { name: 'monounsat', index: 14 },
  { name: 'polyunsat', index: 15 },
  { name: 'id', index: 16 }
];
const fieldIndices = schema.reduce(function (obj, item) {
  obj[item.name] = item.index;
  return obj;
}, {});
const groupCategories = [];
const groupColors = [];
let data;
// zlevel 为 1 的层开启尾迹特效
myChart.getZr().configLayer(1, {
  motionBlur: true
});
// $.get(ROOT_PATH + '/data/asset/data/nutrients.json', function (originData) {
$.get('./nutrients.json', function (originData) {
  data = normalizeData(originData).slice(0, 1000);
  myChart.setOption((option = getOption(data)));
});
function normalizeData(originData) {
  let groupMap = {};
  originData.forEach(function (row) {
    let groupName = row[indices.group];
    if (!groupMap.hasOwnProperty(groupName)) {
      groupMap[groupName] = 1;
    }
  });
  originData.forEach(function (row) {
    row.forEach(function (item, index) {
      if (
        index !== indices.name &&
        index !== indices.group &&
        index !== indices.id
      ) {
        // Convert null to zero, as all of them under unit "g".
        row[index] = parseFloat(item) || 0;
      }
    });
  });
  for (let groupName in groupMap) {
    if (groupMap.hasOwnProperty(groupName)) {
      groupCategories.push(groupName);
    }
  }
  let hStep = Math.round(300 / (groupCategories.length - 1));
  for (let i = 0; i < groupCategories.length; i++) {
    groupColors.push(echarts.color.modifyHSL('#5A94DF', hStep * i));
  }
  return originData;
}
function getOption(data) {
  return {
    xAxis: {
      name: 'protein',
      splitLine: { show: false }
    },
    yAxis: {
      name: 'calcium',
      splitLine: { show: false }
    },
    visualMap: [
      {
        show: false,
        type: 'piecewise',
        categories: groupCategories,
        dimension: 2,
        inRange: {
          color: groupColors
        },
        outOfRange: {
          color: ['#ccc']
        },
        top: 20,
        textStyle: {
          color: '#fff'
        },
        realtime: false
      },
      {
        show: false,
        dimension: 3,
        max: 100,
        inRange: {
          colorLightness: [0.15, 0.6]
        }
      }
    ],
    series: [
      {
        zlevel: 1,
        name: 'nutrients',
        type: 'scatter',
        data: data.map(function (item, idx) {
          return [item[2], item[3], item[1], idx];
        }),
        animationThreshold: 5000,
        progressiveThreshold: 5000
      }
    ],
    animationEasingUpdate: 'cubicInOut',
    animationDurationUpdate: 2000
  };
}
let fieldNames = schema
  .map(function (item) {
    return item.name;
  })
  .slice(2);
app.config = {
  xAxis: 'protein',
  yAxis: 'calcium',
  onChange: function () {
    if (data) {
      myChart.setOption({
        xAxis: {
          name: app.config.xAxis
        },
        yAxis: {
          name: app.config.yAxis
        },
        series: {
          data: data.map(function (item, idx) {
            return [
              item[fieldIndices[app.config.xAxis]],
              item[fieldIndices[app.config.yAxis]],
              item[1],
              idx
            ];
          })
        }
      });
    }
  }
};
app.configParameters = {
  xAxis: {
    options: fieldNames
  },
  yAxis: {
    options: fieldNames
  }
};

    if (option && typeof option === 'object') {
      myChart.setOption(option);
    }

    window.addEventListener('resize', myChart.resize);
  </script>
</body>
</html>
- 效果图

案例4
<!--
	此示例下载自 https://echarts.apache.org/examples/zh/editor.html?c=scatter-polar-punchCard
-->
<!DOCTYPE html>
<html lang="en" style="height: 100%">
<head>
  <meta charset="utf-8">
</head>
<body style="height: 100%; margin: 0">
  <div id="container" style="width: 500px;height: 500px"></div>

  <script type="text/javascript" src="https://registry.npmmirror.com/echarts/5.5.0/files/dist/echarts.min.js"></script>
  <!-- Uncomment this line if you want to dataTool extension
  <script type="text/javascript" src="https://registry.npmmirror.com/echarts/5.5.0/files/dist/extension/dataTool.min.js"></script>
  -->
  <!-- Uncomment this line if you want to use gl extension
  <script type="text/javascript" src="https://registry.npmmirror.com/echarts-gl/2/files/dist/echarts-gl.min.js"></script>
  -->
  <!-- Uncomment this line if you want to echarts-stat extension
  <script type="text/javascript" src="https://registry.npmmirror.com/echarts-stat/latest/files/dist/ecStat.min.js"></script>
  -->
  <!-- Uncomment this line if you want to use map
  <script type="text/javascript" src="https://registry.npmmirror.com/echarts/4.9.0/files/map/js/china.js"></script>
  <script type="text/javascript" src="https://registry.npmmirror.com/echarts/4.9.0/files/map/js/world.js"></script>
  -->
  <!-- Uncomment these two lines if you want to use bmap extension
  <script type="text/javascript" src="https://api.map.baidu.com/api?v=3.0&ak=YOUR_API_KEY"></script>
  <script type="text/javascript" src="https://registry.npmmirror.com/echarts/5.5.0/files/dist/extension/bmap.min.js"></script>
  -->

  <script type="text/javascript">
    var dom = document.getElementById('container');
    var myChart = echarts.init(dom, null, {
      renderer: 'canvas',
      useDirtyRect: false
    });
    var app = {};

    var option;

    // prettier-ignore
const hours = [
    '12a', '1a', '2a', '3a', '4a', '5a', '6a',
    '7a', '8a', '9a', '10a', '11a',
    '12p', '1p', '2p', '3p', '4p', '5p',
    '6p', '7p', '8p', '9p', '10p', '11p'
];
// prettier-ignore
const days = [
    'Saturday', 'Friday', 'Thursday',
    'Wednesday', 'Tuesday', 'Monday', 'Sunday'
];
// prettier-ignore
const data = [[0, 0, 5], [0, 1, 1], [0, 2, 0], [0, 3, 0], [0, 4, 0], [0, 5, 0], [0, 6, 0], [0, 7, 0], [0, 8, 0], [0, 9, 0], [0, 10, 0], [0, 11, 2], [0, 12, 4], [0, 13, 1], [0, 14, 1], [0, 15, 3], [0, 16, 4], [0, 17, 6], [0, 18, 4], [0, 19, 4], [0, 20, 3], [0, 21, 3], [0, 22, 2], [0, 23, 5], [1, 0, 7], [1, 1, 0], [1, 2, 0], [1, 3, 0], [1, 4, 0], [1, 5, 0], [1, 6, 0], [1, 7, 0], [1, 8, 0], [1, 9, 0], [1, 10, 5], [1, 11, 2], [1, 12, 2], [1, 13, 6], [1, 14, 9], [1, 15, 11], [1, 16, 6], [1, 17, 7], [1, 18, 8], [1, 19, 12], [1, 20, 5], [1, 21, 5], [1, 22, 7], [1, 23, 2], [2, 0, 1], [2, 1, 1], [2, 2, 0], [2, 3, 0], [2, 4, 0], [2, 5, 0], [2, 6, 0], [2, 7, 0], [2, 8, 0], [2, 9, 0], [2, 10, 3], [2, 11, 2], [2, 12, 1], [2, 13, 9], [2, 14, 8], [2, 15, 10], [2, 16, 6], [2, 17, 5], [2, 18, 5], [2, 19, 5], [2, 20, 7], [2, 21, 4], [2, 22, 2], [2, 23, 4], [3, 0, 7], [3, 1, 3], [3, 2, 0], [3, 3, 0], [3, 4, 0], [3, 5, 0], [3, 6, 0], [3, 7, 0], [3, 8, 1], [3, 9, 0], [3, 10, 5], [3, 11, 4], [3, 12, 7], [3, 13, 14], [3, 14, 13], [3, 15, 12], [3, 16, 9], [3, 17, 5], [3, 18, 5], [3, 19, 10], [3, 20, 6], [3, 21, 4], [3, 22, 4], [3, 23, 1], [4, 0, 1], [4, 1, 3], [4, 2, 0], [4, 3, 0], [4, 4, 0], [4, 5, 1], [4, 6, 0], [4, 7, 0], [4, 8, 0], [4, 9, 2], [4, 10, 4], [4, 11, 4], [4, 12, 2], [4, 13, 4], [4, 14, 4], [4, 15, 14], [4, 16, 12], [4, 17, 1], [4, 18, 8], [4, 19, 5], [4, 20, 3], [4, 21, 7], [4, 22, 3], [4, 23, 0], [5, 0, 2], [5, 1, 1], [5, 2, 0], [5, 3, 3], [5, 4, 0], [5, 5, 0], [5, 6, 0], [5, 7, 0], [5, 8, 2], [5, 9, 0], [5, 10, 4], [5, 11, 1], [5, 12, 5], [5, 13, 10], [5, 14, 5], [5, 15, 7], [5, 16, 11], [5, 17, 6], [5, 18, 0], [5, 19, 5], [5, 20, 3], [5, 21, 4], [5, 22, 2], [5, 23, 0], [6, 0, 1], [6, 1, 0], [6, 2, 0], [6, 3, 0], [6, 4, 0], [6, 5, 0], [6, 6, 0], [6, 7, 0], [6, 8, 0], [6, 9, 0], [6, 10, 1], [6, 11, 0], [6, 12, 2], [6, 13, 1], [6, 14, 3], [6, 15, 4], [6, 16, 0], [6, 17, 0], [6, 18, 0], [6, 19, 0], [6, 20, 1], [6, 21, 2], [6, 22, 2], [6, 23, 6]];
option = {
  title: {
    text: 'Punch Card of Github'
  },
  legend: {
    data: ['Punch Card'],
    left: 'right'
  },
  polar: {},
  tooltip: {
    formatter: function (params) {
      return (
        params.value[2] +
        ' commits in ' +
        hours[params.value[1]] +
        ' of ' +
        days[params.value[0]]
      );
    }
  },
  angleAxis: {
    type: 'category',
    data: hours,
    boundaryGap: false,
    splitLine: {
      show: true
    },
    axisLine: {
      show: false
    }
  },
  radiusAxis: {
    type: 'category',
    data: days,
    axisLine: {
      show: false
    },
    axisLabel: {
      rotate: 45
    }
  },
  series: [
    {
      name: 'Punch Card',
      type: 'scatter',
      coordinateSystem: 'polar',
      symbolSize: function (val) {
        return val[2] * 2;
      },
      data: data,
      animationDelay: function (idx) {
        return idx * 5;
      }
    }
  ]
};

    if (option && typeof option === 'object') {
      myChart.setOption(option);
    }

    window.addEventListener('resize', myChart.resize);
  </script>
</body>
</html>
- 效果图


 浙公网安备 33010602011771号