起步
案例1
<!--
	此示例下载自 https://echarts.apache.org/examples/zh/editor.html?c=scatter-clustering
-->
<!DOCTYPE html>
<html lang="en" style="height: 100%">
<head>
  <meta charset="utf-8">
</head>
<body style="height: 100%; margin: 0">
  <div id="container" style="width: 600px;height: 500px"></div>

  <script src="./ecStat.min.js"></script>
  <script type="text/javascript" src="https://registry.npmmirror.com/echarts/5.5.0/files/dist/echarts.min.js"></script>
  <!-- Uncomment this line if you want to dataTool extension
  <script type="text/javascript" src="https://registry.npmmirror.com/echarts/5.5.0/files/dist/extension/dataTool.min.js"></script>
  -->
  <!-- Uncomment this line if you want to use gl extension
  <script type="text/javascript" src="https://registry.npmmirror.com/echarts-gl/2/files/dist/echarts-gl.min.js"></script>
  -->
  <!-- Uncomment this line if you want to echarts-stat extension
  <script type="text/javascript" src="https://registry.npmmirror.com/echarts-stat/latest/files/dist/ecStat.min.js"></script>
  -->
  <!-- Uncomment this line if you want to use map
  <script type="text/javascript" src="https://registry.npmmirror.com/echarts/4.9.0/files/map/js/china.js"></script>
  <script type="text/javascript" src="https://registry.npmmirror.com/echarts/4.9.0/files/map/js/world.js"></script>
  -->
  <!-- Uncomment these two lines if you want to use bmap extension
  <script type="text/javascript" src="https://api.map.baidu.com/api?v=3.0&ak=YOUR_API_KEY"></script>
  <script type="text/javascript" src="https://registry.npmmirror.com/echarts/5.5.0/files/dist/extension/bmap.min.js"></script>
  -->

  <script type="text/javascript">
    var dom = document.getElementById('container');
    var myChart = echarts.init(dom, null, {
      renderer: 'canvas',
      useDirtyRect: false
    });
    var app = {};

    var option;

    // See https://github.com/ecomfe/echarts-stat
echarts.registerTransform(ecStat.transform.clustering);
const data = [
  [3.275154, 2.957587],
  [-3.344465, 2.603513],
  [0.355083, -3.376585],
  [1.852435, 3.547351],
  [-2.078973, 2.552013],
  [-0.993756, -0.884433],
  [2.682252, 4.007573],
  [-3.087776, 2.878713],
  [-1.565978, -1.256985],
  [2.441611, 0.444826],
  [-0.659487, 3.111284],
  [-0.459601, -2.618005],
  [2.17768, 2.387793],
  [-2.920969, 2.917485],
  [-0.028814, -4.168078],
  [3.625746, 2.119041],
  [-3.912363, 1.325108],
  [-0.551694, -2.814223],
  [2.855808, 3.483301],
  [-3.594448, 2.856651],
  [0.421993, -2.372646],
  [1.650821, 3.407572],
  [-2.082902, 3.384412],
  [-0.718809, -2.492514],
  [4.513623, 3.841029],
  [-4.822011, 4.607049],
  [-0.656297, -1.449872],
  [1.919901, 4.439368],
  [-3.287749, 3.918836],
  [-1.576936, -2.977622],
  [3.598143, 1.97597],
  [-3.977329, 4.900932],
  [-1.79108, -2.184517],
  [3.914654, 3.559303],
  [-1.910108, 4.166946],
  [-1.226597, -3.317889],
  [1.148946, 3.345138],
  [-2.113864, 3.548172],
  [0.845762, -3.589788],
  [2.629062, 3.535831],
  [-1.640717, 2.990517],
  [-1.881012, -2.485405],
  [4.606999, 3.510312],
  [-4.366462, 4.023316],
  [0.765015, -3.00127],
  [3.121904, 2.173988],
  [-4.025139, 4.65231],
  [-0.559558, -3.840539],
  [4.376754, 4.863579],
  [-1.874308, 4.032237],
  [-0.089337, -3.026809],
  [3.997787, 2.518662],
  [-3.082978, 2.884822],
  [0.845235, -3.454465],
  [1.327224, 3.358778],
  [-2.889949, 3.596178],
  [-0.966018, -2.839827],
  [2.960769, 3.079555],
  [-3.275518, 1.577068],
  [0.639276, -3.41284]
];
var CLUSTER_COUNT = 6;
var DIENSIION_CLUSTER_INDEX = 2;
var COLOR_ALL = [
  '#37A2DA',
  '#e06343',
  '#37a354',
  '#b55dba',
  '#b5bd48',
  '#8378EA',
  '#96BFFF'
];
var pieces = [];
for (var i = 0; i < CLUSTER_COUNT; i++) {
  pieces.push({
    value: i,
    label: 'cluster ' + i,
    color: COLOR_ALL[i]
  });
}
option = {
  dataset: [
    {
      source: data
    },
    {
      transform: {
        type: 'ecStat:clustering',
        // print: true,
        config: {
          clusterCount: CLUSTER_COUNT,
          outputType: 'single',
          outputClusterIndexDimension: DIENSIION_CLUSTER_INDEX
        }
      }
    }
  ],
  tooltip: {
    position: 'top'
  },
  visualMap: {
    type: 'piecewise',
    top: 'middle',
    min: 0,
    max: CLUSTER_COUNT,
    left: 10,
    splitNumber: CLUSTER_COUNT,
    dimension: DIENSIION_CLUSTER_INDEX,
    pieces: pieces
  },
  grid: {
    left: 120
  },
  xAxis: {},
  yAxis: {},
  series: {
    type: 'scatter',
    encode: { tooltip: [0, 1] },
    symbolSize: 15,
    itemStyle: {
      borderColor: '#555'
    },
    datasetIndex: 1
  }
};

    if (option && typeof option === 'object') {
      myChart.setOption(option);
    }

    window.addEventListener('resize', myChart.resize);
  </script>
</body>
</html>
- 效果图

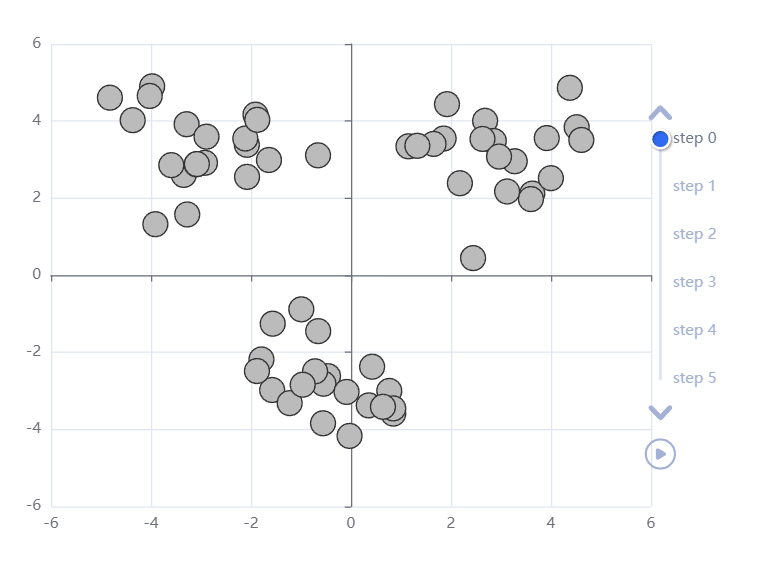
案例2
<!--
	此示例下载自 https://echarts.apache.org/examples/zh/editor.html?c=scatter-clustering-process
-->
<!DOCTYPE html>
<html lang="en" style="height: 100%">
<head>
  <meta charset="utf-8">
</head>
<body style="height: 100%; margin: 0">
  <div id="container" style="width: 600px;height: 500px"></div>

  <script src="./ecStat.min.js"></script>
  <script type="text/javascript" src="https://registry.npmmirror.com/echarts/5.5.0/files/dist/echarts.min.js"></script>
  <!-- Uncomment this line if you want to dataTool extension
  <script type="text/javascript" src="https://registry.npmmirror.com/echarts/5.5.0/files/dist/extension/dataTool.min.js"></script>
  -->
  <!-- Uncomment this line if you want to use gl extension
  <script type="text/javascript" src="https://registry.npmmirror.com/echarts-gl/2/files/dist/echarts-gl.min.js"></script>
  -->
  <!-- Uncomment this line if you want to echarts-stat extension
  <script type="text/javascript" src="https://registry.npmmirror.com/echarts-stat/latest/files/dist/ecStat.min.js"></script>
  -->
  <!-- Uncomment this line if you want to use map
  <script type="text/javascript" src="https://registry.npmmirror.com/echarts/4.9.0/files/map/js/china.js"></script>
  <script type="text/javascript" src="https://registry.npmmirror.com/echarts/4.9.0/files/map/js/world.js"></script>
  -->
  <!-- Uncomment these two lines if you want to use bmap extension
  <script type="text/javascript" src="https://api.map.baidu.com/api?v=3.0&ak=YOUR_API_KEY"></script>
  <script type="text/javascript" src="https://registry.npmmirror.com/echarts/5.5.0/files/dist/extension/bmap.min.js"></script>
  -->

  <script type="text/javascript">
    var dom = document.getElementById('container');
    var myChart = echarts.init(dom, null, {
      renderer: 'canvas',
      useDirtyRect: false
    });
    var app = {};

    var option;

    var originalData = [
  [3.275154, 2.957587],
  [-3.344465, 2.603513],
  [0.355083, -3.376585],
  [1.852435, 3.547351],
  [-2.078973, 2.552013],
  [-0.993756, -0.884433],
  [2.682252, 4.007573],
  [-3.087776, 2.878713],
  [-1.565978, -1.256985],
  [2.441611, 0.444826],
  [-0.659487, 3.111284],
  [-0.459601, -2.618005],
  [2.17768, 2.387793],
  [-2.920969, 2.917485],
  [-0.028814, -4.168078],
  [3.625746, 2.119041],
  [-3.912363, 1.325108],
  [-0.551694, -2.814223],
  [2.855808, 3.483301],
  [-3.594448, 2.856651],
  [0.421993, -2.372646],
  [1.650821, 3.407572],
  [-2.082902, 3.384412],
  [-0.718809, -2.492514],
  [4.513623, 3.841029],
  [-4.822011, 4.607049],
  [-0.656297, -1.449872],
  [1.919901, 4.439368],
  [-3.287749, 3.918836],
  [-1.576936, -2.977622],
  [3.598143, 1.97597],
  [-3.977329, 4.900932],
  [-1.79108, -2.184517],
  [3.914654, 3.559303],
  [-1.910108, 4.166946],
  [-1.226597, -3.317889],
  [1.148946, 3.345138],
  [-2.113864, 3.548172],
  [0.845762, -3.589788],
  [2.629062, 3.535831],
  [-1.640717, 2.990517],
  [-1.881012, -2.485405],
  [4.606999, 3.510312],
  [-4.366462, 4.023316],
  [0.765015, -3.00127],
  [3.121904, 2.173988],
  [-4.025139, 4.65231],
  [-0.559558, -3.840539],
  [4.376754, 4.863579],
  [-1.874308, 4.032237],
  [-0.089337, -3.026809],
  [3.997787, 2.518662],
  [-3.082978, 2.884822],
  [0.845235, -3.454465],
  [1.327224, 3.358778],
  [-2.889949, 3.596178],
  [-0.966018, -2.839827],
  [2.960769, 3.079555],
  [-3.275518, 1.577068],
  [0.639276, -3.41284]
];
var DIM_CLUSTER_INDEX = 2;
var DATA_DIM_IDX = [0, 1];
var CENTER_DIM_IDX = [3, 4];
// See https://github.com/ecomfe/echarts-stat
var step = ecStat.clustering.hierarchicalKMeans(originalData, {
  clusterCount: 6,
  outputType: 'single',
  outputClusterIndexDimension: DIM_CLUSTER_INDEX,
  outputCentroidDimensions: CENTER_DIM_IDX,
  stepByStep: true
});
var colorAll = [
  '#bbb',
  '#37A2DA',
  '#e06343',
  '#37a354',
  '#b55dba',
  '#b5bd48',
  '#8378EA',
  '#96BFFF'
];
var ANIMATION_DURATION_UPDATE = 1500;
function renderItemPoint(params, api) {
  var coord = api.coord([api.value(0), api.value(1)]);
  var clusterIdx = api.value(2);
  if (clusterIdx == null || isNaN(clusterIdx)) {
    clusterIdx = 0;
  }
  var isNewCluster = clusterIdx === api.value(3);
  var extra = {
    transition: []
  };
  var contentColor = colorAll[clusterIdx];
  return {
    type: 'circle',
    x: coord[0],
    y: coord[1],
    shape: {
      cx: 0,
      cy: 0,
      r: 10
    },
    extra: extra,
    style: {
      fill: contentColor,
      stroke: '#333',
      lineWidth: 1,
      shadowColor: contentColor,
      shadowBlur: isNewCluster ? 12 : 0,
      transition: ['shadowBlur', 'fill']
    }
  };
}
function renderBoundary(params, api) {
  var xVal = api.value(0);
  var yVal = api.value(1);
  var maxDist = api.value(2);
  var center = api.coord([xVal, yVal]);
  var size = api.size([maxDist, maxDist]);
  return {
    type: 'ellipse',
    shape: {
      cx: isNaN(center[0]) ? 0 : center[0],
      cy: isNaN(center[1]) ? 0 : center[1],
      rx: isNaN(size[0]) ? 0 : size[0] + 15,
      ry: isNaN(size[1]) ? 0 : size[1] + 15
    },
    extra: {
      renderProgress: ++targetRenderProgress,
      enterFrom: {
        renderProgress: 0
      },
      transition: 'renderProgress'
    },
    style: {
      fill: null,
      stroke: 'rgba(0,0,0,0.2)',
      lineDash: [4, 4],
      lineWidth: 4
    }
  };
}
function makeStepOption(option, data, centroids) {
  var newCluIdx = centroids ? centroids.length - 1 : -1;
  var maxDist = 0;
  for (var i = 0; i < data.length; i++) {
    var line = data[i];
    if (line[DIM_CLUSTER_INDEX] === newCluIdx) {
      var dist0 = Math.pow(line[DATA_DIM_IDX[0]] - line[CENTER_DIM_IDX[0]], 2);
      var dist1 = Math.pow(line[DATA_DIM_IDX[1]] - line[CENTER_DIM_IDX[1]], 2);
      maxDist = Math.max(maxDist, dist0 + dist1);
    }
  }
  var boundaryData = centroids
    ? [[centroids[newCluIdx][0], centroids[newCluIdx][1], Math.sqrt(maxDist)]]
    : [];
  option.options.push({
    series: [
      {
        type: 'custom',
        encode: {
          tooltip: [0, 1]
        },
        renderItem: renderItemPoint,
        data: data
      },
      {
        type: 'custom',
        renderItem: renderBoundary,
        animationDuration: 3000,
        silent: true,
        data: boundaryData
      }
    ]
  });
}
var targetRenderProgress = 0;
option = {
  timeline: {
    top: 'center',
    right: 50,
    height: 300,
    width: 10,
    inverse: true,
    autoPlay: false,
    playInterval: 2500,
    symbol: 'none',
    orient: 'vertical',
    axisType: 'category',
    label: {
      formatter: 'step {value}',
      position: 10
    },
    checkpointStyle: {
      animationDuration: ANIMATION_DURATION_UPDATE
    },
    data: []
  },
  baseOption: {
    animationDurationUpdate: ANIMATION_DURATION_UPDATE,
    transition: ['shape'],
    tooltip: {},
    xAxis: {
      type: 'value'
    },
    yAxis: {
      type: 'value'
    },
    series: [
      {
        type: 'scatter'
      }
    ]
  },
  options: []
};
makeStepOption(option, originalData);
option.timeline.data.push('0');
for (var i = 1, stepResult; !(stepResult = step.next()).isEnd; i++) {
  makeStepOption(
    option,
    echarts.util.clone(stepResult.data),
    echarts.util.clone(stepResult.centroids)
  );
  option.timeline.data.push(i + '');
}

    if (option && typeof option === 'object') {
      myChart.setOption(option);
    }

    window.addEventListener('resize', myChart.resize);
  </script>
</body>
</html>
- 效果图
案例3
<!--
	此示例下载自 https://echarts.apache.org/examples/zh/editor.html?c=scatter-exponential-regression
-->
<!DOCTYPE html>
<html lang="en" style="height: 100%">
<head>
  <meta charset="utf-8">
</head>
<body style="height: 100%; margin: 0">
  <div id="container" style="width: 600px;height: 350px"></div>

  <script src="./ecStat.min.js"></script>
  <script type="text/javascript" src="https://registry.npmmirror.com/echarts/5.5.0/files/dist/echarts.min.js"></script>
  <!-- Uncomment this line if you want to dataTool extension
  <script type="text/javascript" src="https://registry.npmmirror.com/echarts/5.5.0/files/dist/extension/dataTool.min.js"></script>
  -->
  <!-- Uncomment this line if you want to use gl extension
  <script type="text/javascript" src="https://registry.npmmirror.com/echarts-gl/2/files/dist/echarts-gl.min.js"></script>
  -->
  <!-- Uncomment this line if you want to echarts-stat extension
  <script type="text/javascript" src="https://registry.npmmirror.com/echarts-stat/latest/files/dist/ecStat.min.js"></script>
  -->
  <!-- Uncomment this line if you want to use map
  <script type="text/javascript" src="https://registry.npmmirror.com/echarts/4.9.0/files/map/js/china.js"></script>
  <script type="text/javascript" src="https://registry.npmmirror.com/echarts/4.9.0/files/map/js/world.js"></script>
  -->
  <!-- Uncomment these two lines if you want to use bmap extension
  <script type="text/javascript" src="https://api.map.baidu.com/api?v=3.0&ak=YOUR_API_KEY"></script>
  <script type="text/javascript" src="https://registry.npmmirror.com/echarts/5.5.0/files/dist/extension/bmap.min.js"></script>
  -->

  <script type="text/javascript">
    var dom = document.getElementById('container');
    var myChart = echarts.init(dom, null, {
      renderer: 'canvas',
      useDirtyRect: false
    });
    var app = {};

    var option;

    // See https://github.com/ecomfe/echarts-stat
echarts.registerTransform(ecStat.transform.regression);
option = {
  dataset: [
    {
      source: [
        [1, 4862.4],
        [2, 5294.7],
        [3, 5934.5],
        [4, 7171.0],
        [5, 8964.4],
        [6, 10202.2],
        [7, 11962.5],
        [8, 14928.3],
        [9, 16909.2],
        [10, 18547.9],
        [11, 21617.8],
        [12, 26638.1],
        [13, 34634.4],
        [14, 46759.4],
        [15, 58478.1],
        [16, 67884.6],
        [17, 74462.6],
        [18, 79395.7]
      ]
    },
    {
      transform: {
        type: 'ecStat:regression',
        config: {
          method: 'exponential'
          // 'end' by default
          // formulaOn: 'start'
        }
      }
    }
  ],
  title: {
    text: '1981 - 1998 gross domestic product GDP (trillion yuan)',
    subtext: 'By ecStat.regression',
    sublink: 'https://github.com/ecomfe/echarts-stat',
    left: 'center'
  },
  tooltip: {
    trigger: 'axis',
    axisPointer: {
      type: 'cross'
    }
  },
  xAxis: {
    splitLine: {
      lineStyle: {
        type: 'dashed'
      }
    }
  },
  yAxis: {
    splitLine: {
      lineStyle: {
        type: 'dashed'
      }
    }
  },
  series: [
    {
      name: 'scatter',
      type: 'scatter',
      datasetIndex: 0
    },
    {
      name: 'line',
      type: 'line',
      smooth: true,
      datasetIndex: 1,
      symbolSize: 0.1,
      symbol: 'circle',
      label: { show: true, fontSize: 16 },
      labelLayout: { dx: -20 },
      encode: { label: 2, tooltip: 1 }
    }
  ]
};

    if (option && typeof option === 'object') {
      myChart.setOption(option);
    }

    window.addEventListener('resize', myChart.resize);
  </script>
</body>
</html>
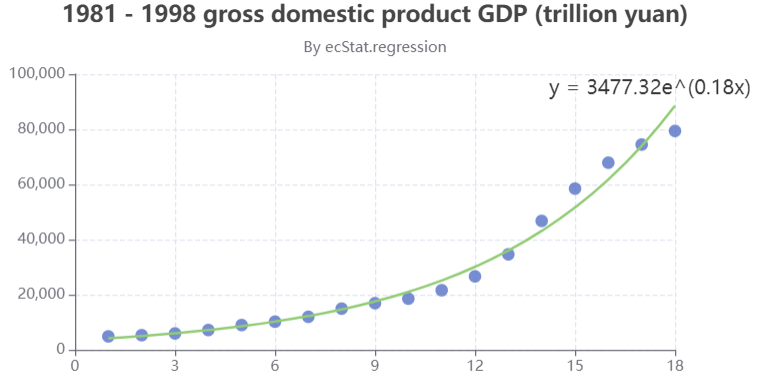
- 效果图
案例4
<!--
	此示例下载自 https://echarts.apache.org/examples/zh/editor.html?c=scatter-linear-regression
-->
<!DOCTYPE html>
<html lang="en" style="height: 100%">
<head>
  <meta charset="utf-8">
</head>
<body style="height: 100%; margin: 0">
  <div id="container" style="width: 600px;height: 350px"></div>

  <script src="./ecStat.min.js"></script>
  <script type="text/javascript" src="https://registry.npmmirror.com/echarts/5.5.0/files/dist/echarts.min.js"></script>
  <!-- Uncomment this line if you want to dataTool extension
  <script type="text/javascript" src="https://registry.npmmirror.com/echarts/5.5.0/files/dist/extension/dataTool.min.js"></script>
  -->
  <!-- Uncomment this line if you want to use gl extension
  <script type="text/javascript" src="https://registry.npmmirror.com/echarts-gl/2/files/dist/echarts-gl.min.js"></script>
  -->
  <!-- Uncomment this line if you want to echarts-stat extension
  <script type="text/javascript" src="https://registry.npmmirror.com/echarts-stat/latest/files/dist/ecStat.min.js"></script>
  -->
  <!-- Uncomment this line if you want to use map
  <script type="text/javascript" src="https://registry.npmmirror.com/echarts/4.9.0/files/map/js/china.js"></script>
  <script type="text/javascript" src="https://registry.npmmirror.com/echarts/4.9.0/files/map/js/world.js"></script>
  -->
  <!-- Uncomment these two lines if you want to use bmap extension
  <script type="text/javascript" src="https://api.map.baidu.com/api?v=3.0&ak=YOUR_API_KEY"></script>
  <script type="text/javascript" src="https://registry.npmmirror.com/echarts/5.5.0/files/dist/extension/bmap.min.js"></script>
  -->

  <script type="text/javascript">
    var dom = document.getElementById('container');
    var myChart = echarts.init(dom, null, {
      renderer: 'canvas',
      useDirtyRect: false
    });
    var app = {};

    var option;

    // See https://github.com/ecomfe/echarts-stat
echarts.registerTransform(ecStat.transform.regression);
const data = [
  [0.067732, 3.176513],
  [0.42781, 3.816464],
  [0.995731, 4.550095],
  [0.738336, 4.256571],
  [0.981083, 4.560815],
  [0.526171, 3.929515],
  [0.378887, 3.52617],
  [0.033859, 3.156393],
  [0.132791, 3.110301],
  [0.138306, 3.149813],
  [0.247809, 3.476346],
  [0.64827, 4.119688],
  [0.731209, 4.282233],
  [0.236833, 3.486582],
  [0.969788, 4.655492],
  [0.607492, 3.965162],
  [0.358622, 3.5149],
  [0.147846, 3.125947],
  [0.63782, 4.094115],
  [0.230372, 3.476039],
  [0.070237, 3.21061],
  [0.067154, 3.190612],
  [0.925577, 4.631504],
  [0.717733, 4.29589],
  [0.015371, 3.085028],
  [0.33507, 3.44808],
  [0.040486, 3.16744],
  [0.212575, 3.364266],
  [0.617218, 3.993482],
  [0.541196, 3.891471],
  [0.045353, 3.143259],
  [0.126762, 3.114204],
  [0.556486, 3.851484],
  [0.901144, 4.621899],
  [0.958476, 4.580768],
  [0.274561, 3.620992],
  [0.394396, 3.580501],
  [0.87248, 4.618706],
  [0.409932, 3.676867],
  [0.908969, 4.641845],
  [0.166819, 3.175939],
  [0.665016, 4.26498],
  [0.263727, 3.558448],
  [0.231214, 3.436632],
  [0.552928, 3.831052],
  [0.047744, 3.182853],
  [0.365746, 3.498906],
  [0.495002, 3.946833],
  [0.493466, 3.900583],
  [0.792101, 4.238522],
  [0.76966, 4.23308],
  [0.251821, 3.521557],
  [0.181951, 3.203344],
  [0.808177, 4.278105],
  [0.334116, 3.555705],
  [0.33863, 3.502661],
  [0.452584, 3.859776],
  [0.69477, 4.275956],
  [0.590902, 3.916191],
  [0.307928, 3.587961],
  [0.148364, 3.183004],
  [0.70218, 4.225236],
  [0.721544, 4.231083],
  [0.666886, 4.240544],
  [0.124931, 3.222372],
  [0.618286, 4.021445],
  [0.381086, 3.567479],
  [0.385643, 3.56258],
  [0.777175, 4.262059],
  [0.116089, 3.208813],
  [0.115487, 3.169825],
  [0.66351, 4.193949],
  [0.254884, 3.491678],
  [0.993888, 4.533306],
  [0.295434, 3.550108],
  [0.952523, 4.636427],
  [0.307047, 3.557078],
  [0.277261, 3.552874],
  [0.279101, 3.494159],
  [0.175724, 3.206828],
  [0.156383, 3.195266],
  [0.733165, 4.221292],
  [0.848142, 4.413372],
  [0.771184, 4.184347],
  [0.429492, 3.742878],
  [0.162176, 3.201878],
  [0.917064, 4.648964],
  [0.315044, 3.510117],
  [0.201473, 3.274434],
  [0.297038, 3.579622],
  [0.336647, 3.489244],
  [0.666109, 4.237386],
  [0.583888, 3.913749],
  [0.085031, 3.22899],
  [0.687006, 4.286286],
  [0.949655, 4.628614],
  [0.189912, 3.239536],
  [0.844027, 4.457997],
  [0.333288, 3.513384],
  [0.427035, 3.729674],
  [0.466369, 3.834274],
  [0.550659, 3.811155],
  [0.278213, 3.598316],
  [0.918769, 4.692514],
  [0.886555, 4.604859],
  [0.569488, 3.864912],
  [0.066379, 3.184236],
  [0.335751, 3.500796],
  [0.426863, 3.743365],
  [0.395746, 3.622905],
  [0.694221, 4.310796],
  [0.27276, 3.583357],
  [0.503495, 3.901852],
  [0.067119, 3.233521],
  [0.038326, 3.105266],
  [0.599122, 3.865544],
  [0.947054, 4.628625],
  [0.671279, 4.231213],
  [0.434811, 3.791149],
  [0.509381, 3.968271],
  [0.749442, 4.25391],
  [0.058014, 3.19471],
  [0.482978, 3.996503],
  [0.466776, 3.904358],
  [0.357767, 3.503976],
  [0.949123, 4.557545],
  [0.41732, 3.699876],
  [0.920461, 4.613614],
  [0.156433, 3.140401],
  [0.656662, 4.206717],
  [0.616418, 3.969524],
  [0.853428, 4.476096],
  [0.133295, 3.136528],
  [0.693007, 4.279071],
  [0.178449, 3.200603],
  [0.199526, 3.299012],
  [0.073224, 3.209873],
  [0.286515, 3.632942],
  [0.182026, 3.248361],
  [0.621523, 3.995783],
  [0.344584, 3.563262],
  [0.398556, 3.649712],
  [0.480369, 3.951845],
  [0.15335, 3.145031],
  [0.171846, 3.181577],
  [0.867082, 4.637087],
  [0.223855, 3.404964],
  [0.528301, 3.873188],
  [0.890192, 4.633648],
  [0.106352, 3.154768],
  [0.917886, 4.623637],
  [0.014855, 3.078132],
  [0.567682, 3.913596],
  [0.068854, 3.221817],
  [0.603535, 3.938071],
  [0.53205, 3.880822],
  [0.651362, 4.176436],
  [0.901225, 4.648161],
  [0.204337, 3.332312],
  [0.696081, 4.240614],
  [0.963924, 4.532224],
  [0.98139, 4.557105],
  [0.987911, 4.610072],
  [0.990947, 4.636569],
  [0.736021, 4.229813],
  [0.253574, 3.50086],
  [0.674722, 4.245514],
  [0.939368, 4.605182],
  [0.235419, 3.45434],
  [0.110521, 3.180775],
  [0.218023, 3.38082],
  [0.869778, 4.56502],
  [0.19683, 3.279973],
  [0.958178, 4.554241],
  [0.972673, 4.63352],
  [0.745797, 4.281037],
  [0.445674, 3.844426],
  [0.470557, 3.891601],
  [0.549236, 3.849728],
  [0.335691, 3.492215],
  [0.884739, 4.592374],
  [0.918916, 4.632025],
  [0.441815, 3.75675],
  [0.116598, 3.133555],
  [0.359274, 3.567919],
  [0.814811, 4.363382],
  [0.387125, 3.560165],
  [0.982243, 4.564305],
  [0.78088, 4.215055],
  [0.652565, 4.174999],
  [0.87003, 4.58664],
  [0.604755, 3.960008],
  [0.255212, 3.529963],
  [0.730546, 4.213412],
  [0.493829, 3.908685],
  [0.257017, 3.585821],
  [0.833735, 4.374394],
  [0.070095, 3.213817],
  [0.52707, 3.952681],
  [0.116163, 3.129283]
];
option = {
  dataset: [
    {
      source: data
    },
    {
      transform: {
        type: 'ecStat:regression'
        // 'linear' by default.
        // config: { method: 'linear', formulaOn: 'end'}
      }
    }
  ],
  title: {
    text: 'Linear Regression',
    subtext: 'By ecStat.regression',
    sublink: 'https://github.com/ecomfe/echarts-stat',
    left: 'center'
  },
  legend: {
    bottom: 5
  },
  tooltip: {
    trigger: 'axis',
    axisPointer: {
      type: 'cross'
    }
  },
  xAxis: {
    splitLine: {
      lineStyle: {
        type: 'dashed'
      }
    }
  },
  yAxis: {
    splitLine: {
      lineStyle: {
        type: 'dashed'
      }
    }
  },
  series: [
    {
      name: 'scatter',
      type: 'scatter'
    },
    {
      name: 'line',
      type: 'line',
      datasetIndex: 1,
      symbolSize: 0.1,
      symbol: 'circle',
      label: { show: true, fontSize: 16 },
      labelLayout: { dx: -20 },
      encode: { label: 2, tooltip: 1 }
    }
  ]
};

    if (option && typeof option === 'object') {
      myChart.setOption(option);
    }

    window.addEventListener('resize', myChart.resize);
  </script>
</body>
</html>
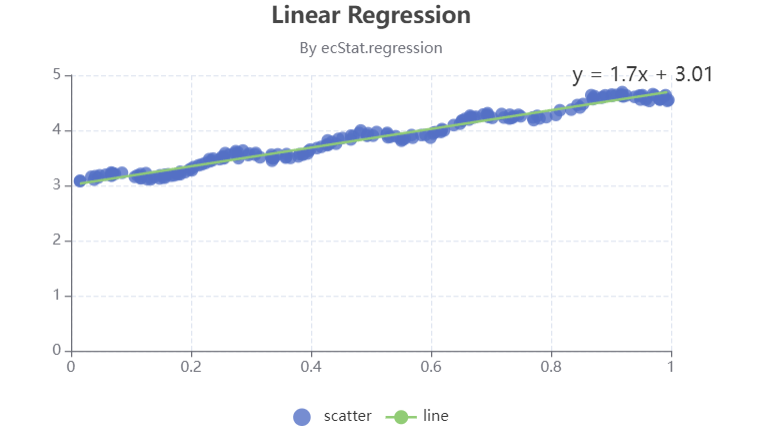
- 效果图
案例5
<!--
	此示例下载自 https://echarts.apache.org/examples/zh/editor.html?c=scatter-polynomial-regression
-->
<!DOCTYPE html>
<html lang="en" style="height: 100%">
<head>
  <meta charset="utf-8">
</head>
<body style="height: 100%; margin: 0">
  <div id="container" style="width: 800px;height: 350px"></div>

  <script src="./ecStat.min.js"></script>
  <script type="text/javascript" src="https://registry.npmmirror.com/echarts/5.5.0/files/dist/echarts.min.js"></script>
  <!-- Uncomment this line if you want to dataTool extension
  <script type="text/javascript" src="https://registry.npmmirror.com/echarts/5.5.0/files/dist/extension/dataTool.min.js"></script>
  -->
  <!-- Uncomment this line if you want to use gl extension
  <script type="text/javascript" src="https://registry.npmmirror.com/echarts-gl/2/files/dist/echarts-gl.min.js"></script>
  -->
  <!-- Uncomment this line if you want to echarts-stat extension
  <script type="text/javascript" src="https://registry.npmmirror.com/echarts-stat/latest/files/dist/ecStat.min.js"></script>
  -->
  <!-- Uncomment this line if you want to use map
  <script type="text/javascript" src="https://registry.npmmirror.com/echarts/4.9.0/files/map/js/china.js"></script>
  <script type="text/javascript" src="https://registry.npmmirror.com/echarts/4.9.0/files/map/js/world.js"></script>
  -->
  <!-- Uncomment these two lines if you want to use bmap extension
  <script type="text/javascript" src="https://api.map.baidu.com/api?v=3.0&ak=YOUR_API_KEY"></script>
  <script type="text/javascript" src="https://registry.npmmirror.com/echarts/5.5.0/files/dist/extension/bmap.min.js"></script>
  -->

  <script type="text/javascript">
    var dom = document.getElementById('container');
    var myChart = echarts.init(dom, null, {
      renderer: 'canvas',
      useDirtyRect: false
    });
    var app = {};

    var option;

    // See https://github.com/ecomfe/echarts-stat
echarts.registerTransform(ecStat.transform.regression);
const data = [
  [96.24, 11.35],
  [33.09, 85.11],
  [57.6, 36.61],
  [36.77, 27.26],
  [20.1, 6.72],
  [45.53, 36.37],
  [110.07, 80.13],
  [72.05, 20.88],
  [39.82, 37.15],
  [48.05, 70.5],
  [0.85, 2.57],
  [51.66, 63.7],
  [61.07, 127.13],
  [64.54, 33.59],
  [35.5, 25.01],
  [226.55, 664.02],
  [188.6, 175.31],
  [81.31, 108.68]
];
option = {
  dataset: [
    {
      source: data
    },
    {
      transform: {
        type: 'ecStat:regression',
        config: { method: 'polynomial', order: 3 }
      }
    }
  ],
  title: {
    text: '18 companies net profit and main business income (million)',
    subtext: 'By ecStat.regression',
    sublink: 'https://github.com/ecomfe/echarts-stat',
    left: 'center',
    top: 16
  },
  tooltip: {
    trigger: 'axis',
    axisPointer: {
      type: 'cross'
    }
  },
  xAxis: {
    splitLine: {
      lineStyle: {
        type: 'dashed'
      }
    },
    splitNumber: 20
  },
  yAxis: {
    min: -40,
    splitLine: {
      lineStyle: {
        type: 'dashed'
      }
    }
  },
  series: [
    {
      name: 'scatter',
      type: 'scatter'
    },
    {
      name: 'line',
      type: 'line',
      smooth: true,
      datasetIndex: 1,
      symbolSize: 0.1,
      symbol: 'circle',
      label: { show: true, fontSize: 16 },
      labelLayout: { dx: -20 },
      encode: { label: 2, tooltip: 1 }
    }
  ]
};

    if (option && typeof option === 'object') {
      myChart.setOption(option);
    }

    window.addEventListener('resize', myChart.resize);
  </script>
</body>
</html>
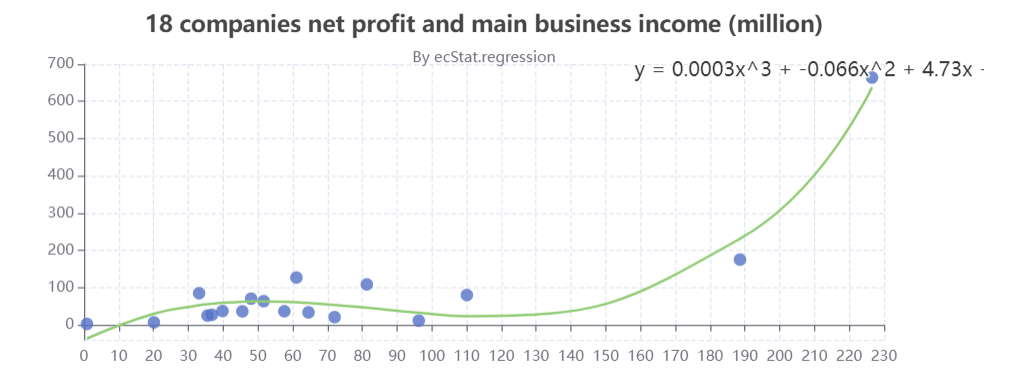
- 效果图
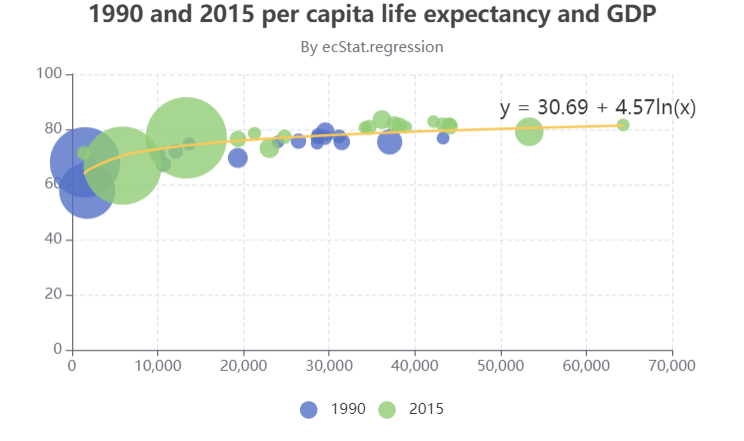
案例6
<!--
	此示例下载自 https://echarts.apache.org/examples/zh/editor.html?c=scatter-logarithmic-regression
-->
<!DOCTYPE html>
<html lang="en" style="height: 100%">
<head>
  <meta charset="utf-8">
</head>
<body style="height: 100%; margin: 0">
  <div id="container" style="width: 600px;height: 350px"></div>

  <script src="./ecStat.min.js"></script>
  <script type="text/javascript" src="https://registry.npmmirror.com/echarts/5.5.0/files/dist/echarts.min.js"></script>
  <!-- Uncomment this line if you want to dataTool extension
  <script type="text/javascript" src="https://registry.npmmirror.com/echarts/5.5.0/files/dist/extension/dataTool.min.js"></script>
  -->
  <!-- Uncomment this line if you want to use gl extension
  <script type="text/javascript" src="https://registry.npmmirror.com/echarts-gl/2/files/dist/echarts-gl.min.js"></script>
  -->
  <!-- Uncomment this line if you want to echarts-stat extension
  <script type="text/javascript" src="https://registry.npmmirror.com/echarts-stat/latest/files/dist/ecStat.min.js"></script>
  -->
  <!-- Uncomment this line if you want to use map
  <script type="text/javascript" src="https://registry.npmmirror.com/echarts/4.9.0/files/map/js/china.js"></script>
  <script type="text/javascript" src="https://registry.npmmirror.com/echarts/4.9.0/files/map/js/world.js"></script>
  -->
  <!-- Uncomment these two lines if you want to use bmap extension
  <script type="text/javascript" src="https://api.map.baidu.com/api?v=3.0&ak=YOUR_API_KEY"></script>
  <script type="text/javascript" src="https://registry.npmmirror.com/echarts/5.5.0/files/dist/extension/bmap.min.js"></script>
  -->

  <script type="text/javascript">
    var dom = document.getElementById('container');
    var myChart = echarts.init(dom, null, {
      renderer: 'canvas',
      useDirtyRect: false
    });
    var app = {};

    var option;

    // See https://github.com/ecomfe/echarts-stat
echarts.registerTransform(ecStat.transform.regression);
option = {
  dataset: [
    {
      source: [
        [28604, 77, 17096869, 'Australia', 1990],
        [31163, 77.4, 27662440, 'Canada', 1990],
        [1516, 68, 1154605773, 'China', 1990],
        [13670, 74.7, 10582082, 'Cuba', 1990],
        [28599, 75, 4986705, 'Finland', 1990],
        [29476, 77.1, 56943299, 'France', 1990],
        [31476, 75.4, 78958237, 'Germany', 1990],
        [28666, 78.1, 254830, 'Iceland', 1990],
        [1777, 57.7, 870601776, 'India', 1990],
        [29550, 79.1, 122249285, 'Japan', 1990],
        [2076, 67.9, 20194354, 'North Korea', 1990],
        [12087, 72, 42972254, 'South Korea', 1990],
        [24021, 75.4, 3397534, 'New Zealand', 1990],
        [43296, 76.8, 4240375, 'Norway', 1990],
        [10088, 70.8, 38195258, 'Poland', 1990],
        [19349, 69.6, 147568552, 'Russia', 1990],
        [10670, 67.3, 53994605, 'Turkey', 1990],
        [26424, 75.7, 57110117, 'United Kingdom', 1990],
        [37062, 75.4, 252847810, 'United States', 1990],
        [44056, 81.8, 23968973, 'Australia', 2015],
        [43294, 81.7, 35939927, 'Canada', 2015],
        [13334, 76.9, 1376048943, 'China', 2015],
        [21291, 78.5, 11389562, 'Cuba', 2015],
        [38923, 80.8, 5503457, 'Finland', 2015],
        [37599, 81.9, 64395345, 'France', 2015],
        [44053, 81.1, 80688545, 'Germany', 2015],
        [42182, 82.8, 329425, 'Iceland', 2015],
        [5903, 66.8, 1311050527, 'India', 2015],
        [36162, 83.5, 126573481, 'Japan', 2015],
        [1390, 71.4, 25155317, 'North Korea', 2015],
        [34644, 80.7, 50293439, 'South Korea', 2015],
        [34186, 80.6, 4528526, 'New Zealand', 2015],
        [64304, 81.6, 5210967, 'Norway', 2015],
        [24787, 77.3, 38611794, 'Poland', 2015],
        [23038, 73.13, 143456918, 'Russia', 2015],
        [19360, 76.5, 78665830, 'Turkey', 2015],
        [38225, 81.4, 64715810, 'United Kingdom', 2015],
        [53354, 79.1, 321773631, 'United States', 2015]
      ]
    },
    {
      transform: {
        type: 'filter',
        config: { dimension: 4, eq: 1990 }
      }
    },
    {
      transform: {
        type: 'filter',
        config: { dimension: 4, eq: 2015 }
      }
    },
    {
      transform: {
        type: 'ecStat:regression',
        config: {
          method: 'logarithmic'
        }
      }
    }
  ],
  title: {
    text: '1990 and 2015 per capita life expectancy and GDP',
    subtext: 'By ecStat.regression',
    sublink: 'https://github.com/ecomfe/echarts-stat',
    left: 'center'
  },
  legend: {
    data: ['1990', '2015'],
    bottom: 10
  },
  tooltip: {
    trigger: 'axis',
    axisPointer: {
      type: 'cross'
    }
  },
  xAxis: {
    type: 'value',
    splitLine: {
      lineStyle: {
        type: 'dashed'
      }
    }
  },
  yAxis: {
    type: 'value',
    splitLine: {
      lineStyle: {
        type: 'dashed'
      }
    }
  },
  visualMap: {
    show: false,
    dimension: 2,
    min: 20000,
    max: 1500000000,
    seriesIndex: [0, 1],
    inRange: {
      symbolSize: [10, 70]
    }
  },
  series: [
    {
      name: '1990',
      type: 'scatter',
      datasetIndex: 1
    },
    {
      name: '2015',
      type: 'scatter',
      datasetIndex: 2
    },
    {
      name: 'line',
      type: 'line',
      smooth: true,
      datasetIndex: 3,
      symbolSize: 0.1,
      symbol: 'circle',
      label: { show: true, fontSize: 16 },
      labelLayout: { dx: -20 },
      encode: { label: 2, tooltip: 1 }
    }
  ]
};

    if (option && typeof option === 'object') {
      myChart.setOption(option);
    }

    window.addEventListener('resize', myChart.resize);
  </script>
</body>
</html>
- 效果图

 浙公网安备 33010602011771号