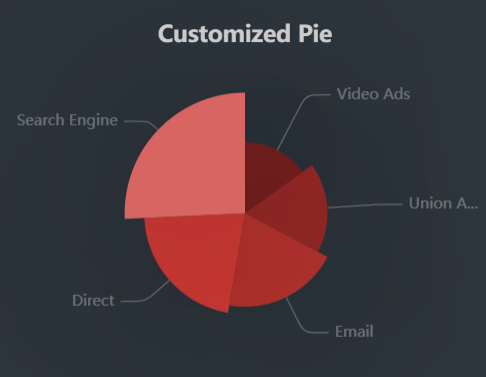
案例1
<!--
	此示例下载自 https://echarts.apache.org/examples/zh/editor.html?c=pie-custom
-->
<!DOCTYPE html>
<html lang="en" style="height: 100%">
<head>
  <meta charset="utf-8">
</head>
<body style="height: 100%; margin: 0">
  <div id="container" style="width: 400px;height: 350px"></div>

  <script type="text/javascript" src="https://registry.npmmirror.com/echarts/5.5.0/files/dist/echarts.min.js"></script>
  <!-- Uncomment this line if you want to dataTool extension
  <script type="text/javascript" src="https://registry.npmmirror.com/echarts/5.5.0/files/dist/extension/dataTool.min.js"></script>
  -->
  <!-- Uncomment this line if you want to use gl extension
  <script type="text/javascript" src="https://registry.npmmirror.com/echarts-gl/2/files/dist/echarts-gl.min.js"></script>
  -->
  <!-- Uncomment this line if you want to echarts-stat extension
  <script type="text/javascript" src="https://registry.npmmirror.com/echarts-stat/latest/files/dist/ecStat.min.js"></script>
  -->
  <!-- Uncomment this line if you want to use map
  <script type="text/javascript" src="https://registry.npmmirror.com/echarts/4.9.0/files/map/js/china.js"></script>
  <script type="text/javascript" src="https://registry.npmmirror.com/echarts/4.9.0/files/map/js/world.js"></script>
  -->
  <!-- Uncomment these two lines if you want to use bmap extension
  <script type="text/javascript" src="https://api.map.baidu.com/api?v=3.0&ak=YOUR_API_KEY"></script>
  <script type="text/javascript" src="https://registry.npmmirror.com/echarts/5.5.0/files/dist/extension/bmap.min.js"></script>
  -->

  <script type="text/javascript">
    var dom = document.getElementById('container');
    var myChart = echarts.init(dom, null, {
      renderer: 'canvas',
      useDirtyRect: false
    });
    var app = {};

    var option;

    option = {
  backgroundColor: '#2c343c',
  title: {
    text: 'Customized Pie',
    left: 'center',
    top: 20,
    textStyle: {
      color: '#ccc'
    }
  },
  tooltip: {
    trigger: 'item'
  },
  visualMap: {
    show: false,
    min: 80,
    max: 600,
    inRange: {
      colorLightness: [0, 1]
    }
  },
  series: [
    {
      name: 'Access From',
      type: 'pie',
      radius: '55%',
      center: ['50%', '50%'],
      data: [
        { value: 335, name: 'Direct' },
        { value: 310, name: 'Email' },
        { value: 274, name: 'Union Ads' },
        { value: 235, name: 'Video Ads' },
        { value: 400, name: 'Search Engine' }
      ].sort(function (a, b) {
        return a.value - b.value;
      }),
      roseType: 'radius',
      label: {
        color: 'rgba(255, 255, 255, 0.3)'
      },
      labelLine: {
        lineStyle: {
          color: 'rgba(255, 255, 255, 0.3)'
        },
        smooth: 0.2,
        length: 10,
        length2: 20
      },
      itemStyle: {
        color: '#c23531',
        shadowBlur: 200,
        shadowColor: 'rgba(0, 0, 0, 0.5)'
      },
      animationType: 'scale',
      animationEasing: 'elasticOut',
      animationDelay: function (idx) {
        return Math.random() * 200;
      }
    }
  ]
};

    if (option && typeof option === 'object') {
      myChart.setOption(option);
    }

    window.addEventListener('resize', myChart.resize);
  </script>
</body>
</html>
- 效果图
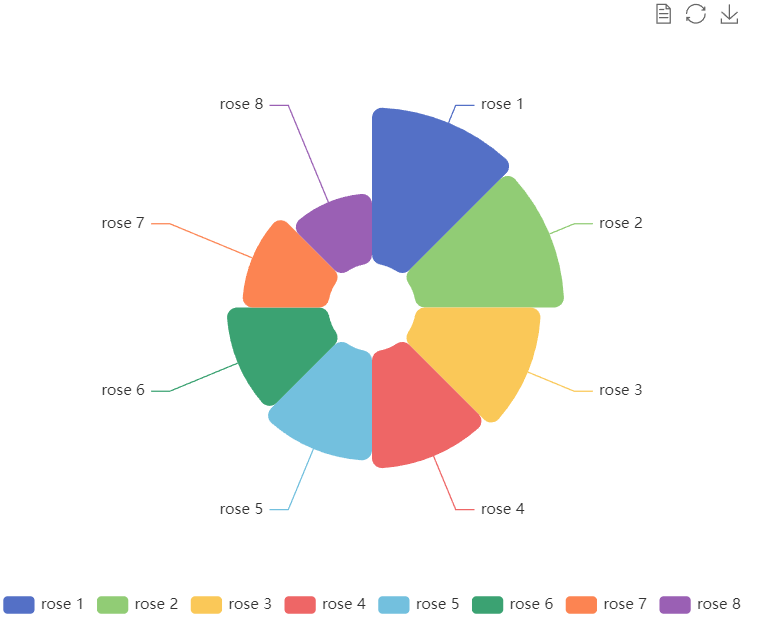
案例2
<!--
	此示例下载自 https://echarts.apache.org/examples/zh/editor.html?c=pie-roseType-simple
-->
<!DOCTYPE html>
<html lang="en" style="height: 100%">
<head>
  <meta charset="utf-8">
</head>
<body style="height: 100%; margin: 0">
  <div id="container" style="width: 600px;height: 500px"></div>

  <script type="text/javascript" src="https://registry.npmmirror.com/echarts/5/files/dist/echarts.min.js"></script>
  <!-- Uncomment this line if you want to dataTool extension
  <script type="text/javascript" src="https://registry.npmmirror.com/echarts/5/files/dist/extension/dataTool.min.js"></script>
  -->
  <!-- Uncomment this line if you want to use gl extension
  <script type="text/javascript" src="https://registry.npmmirror.com/echarts-gl/2/files/dist/echarts-gl.min.js"></script>
  -->
  <!-- Uncomment this line if you want to echarts-stat extension
  <script type="text/javascript" src="https://registry.npmmirror.com/echarts-stat/latest/files/dist/ecStat.min.js"></script>
  -->
  <!-- Uncomment this line if you want to use map
  <script type="text/javascript" src="https://registry.npmmirror.com/echarts/4.9.0/files/map/js/china.js"></script>
  <script type="text/javascript" src="https://registry.npmmirror.com/echarts/4.9.0/files/map/js/world.js"></script>
  -->
  <!-- Uncomment these two lines if you want to use bmap extension
  <script type="text/javascript" src="https://api.map.baidu.com/api?v=3.0&ak=YOUR_API_KEY"></script>
  <script type="text/javascript" src="https://registry.npmmirror.com/echarts/5/files/dist/extension/bmap.min.js"></script>
  -->

  <script type="text/javascript">
    var dom = document.getElementById('container');
    var myChart = echarts.init(dom, null, {
      renderer: 'canvas',
      useDirtyRect: false
    });
    var app = {};

    var option;

    option = {
  legend: {
    top: 'bottom'
  },
  toolbox: {
    show: true,
    feature: {
      mark: { show: true },
      dataView: { show: true, readOnly: false },
      restore: { show: true },
      saveAsImage: { show: true }
    }
  },
  series: [
    {
      name: 'Nightingale Chart',
      type: 'pie',
      radius: [35, 160],
      center: ['50%', '50%'],
      roseType: 'area',
      itemStyle: {
        borderRadius: 8
      },
      data: [
        { value: 40, name: 'rose 1' },
        { value: 38, name: 'rose 2' },
        { value: 32, name: 'rose 3' },
        { value: 30, name: 'rose 4' },
        { value: 28, name: 'rose 5' },
        { value: 26, name: 'rose 6' },
        { value: 22, name: 'rose 7' },
        { value: 18, name: 'rose 8' }
      ]
    }
  ]
};

    if (option && typeof option === 'object') {
      myChart.setOption(option);
    }

    window.addEventListener('resize', myChart.resize);
  </script>
</body>
</html>
- 效果图
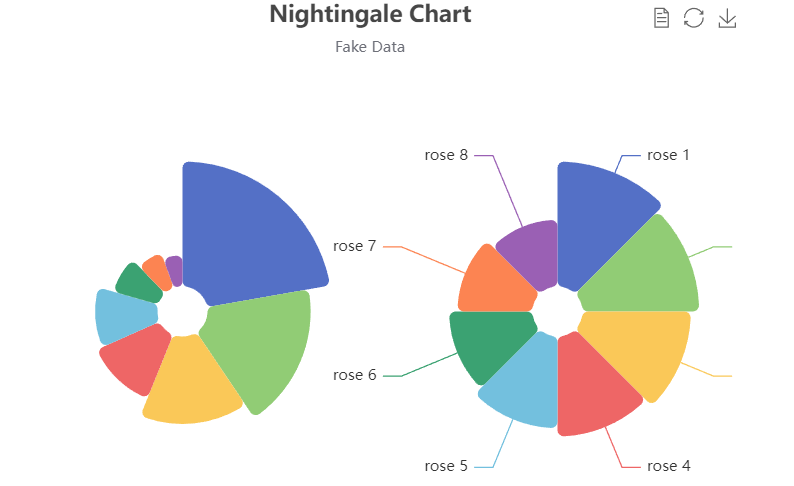
案例3
<!--
	此示例下载自 https://echarts.apache.org/examples/zh/editor.html?c=pie-roseType
-->
<!DOCTYPE html>
<html lang="en" style="height: 100%">
<head>
  <meta charset="utf-8">
</head>
<body style="height: 100%; margin: 0">
  <div id="container" style="width: 600px;height: 500px"></div>

  <script type="text/javascript" src="https://registry.npmmirror.com/echarts/5/files/dist/echarts.min.js"></script>
  <!-- Uncomment this line if you want to dataTool extension
  <script type="text/javascript" src="https://registry.npmmirror.com/echarts/5/files/dist/extension/dataTool.min.js"></script>
  -->
  <!-- Uncomment this line if you want to use gl extension
  <script type="text/javascript" src="https://registry.npmmirror.com/echarts-gl/2/files/dist/echarts-gl.min.js"></script>
  -->
  <!-- Uncomment this line if you want to echarts-stat extension
  <script type="text/javascript" src="https://registry.npmmirror.com/echarts-stat/latest/files/dist/ecStat.min.js"></script>
  -->
  <!-- Uncomment this line if you want to use map
  <script type="text/javascript" src="https://registry.npmmirror.com/echarts/4.9.0/files/map/js/china.js"></script>
  <script type="text/javascript" src="https://registry.npmmirror.com/echarts/4.9.0/files/map/js/world.js"></script>
  -->
  <!-- Uncomment these two lines if you want to use bmap extension
  <script type="text/javascript" src="https://api.map.baidu.com/api?v=3.0&ak=YOUR_API_KEY"></script>
  <script type="text/javascript" src="https://registry.npmmirror.com/echarts/5/files/dist/extension/bmap.min.js"></script>
  -->

  <script type="text/javascript">
    var dom = document.getElementById('container');
    var myChart = echarts.init(dom, null, {
      renderer: 'canvas',
      useDirtyRect: false
    });
    var app = {};

    var option;

    option = {
  title: {
    text: 'Nightingale Chart',
    subtext: 'Fake Data',
    left: 'center'
  },
  tooltip: {
    trigger: 'item',
    formatter: '{a} <br/>{b} : {c} ({d}%)'
  },
  legend: {
    left: 'center',
    top: 'bottom',
    data: [
      'rose1',
      'rose2',
      'rose3',
      'rose4',
      'rose5',
      'rose6',
      'rose7',
      'rose8'
    ]
  },
  toolbox: {
    show: true,
    feature: {
      mark: { show: true },
      dataView: { show: true, readOnly: false },
      restore: { show: true },
      saveAsImage: { show: true }
    }
  },
  series: [
    {
      name: 'Radius Mode',
      type: 'pie',
      radius: [20, 120],
      center: ['25%', '50%'],
      roseType: 'radius',
      itemStyle: {
        borderRadius: 5
      },
      label: {
        show: false
      },
      emphasis: {
        label: {
          show: true
        }
      },
      data: [
        { value: 40, name: 'rose 1' },
        { value: 33, name: 'rose 2' },
        { value: 28, name: 'rose 3' },
        { value: 22, name: 'rose 4' },
        { value: 20, name: 'rose 5' },
        { value: 15, name: 'rose 6' },
        { value: 12, name: 'rose 7' },
        { value: 10, name: 'rose 8' }
      ]
    },
    {
      name: 'Area Mode',
      type: 'pie',
      radius: [20, 120],
      center: ['75%', '50%'],
      roseType: 'area',
      itemStyle: {
        borderRadius: 5
      },
      data: [
        { value: 30, name: 'rose 1' },
        { value: 28, name: 'rose 2' },
        { value: 26, name: 'rose 3' },
        { value: 24, name: 'rose 4' },
        { value: 22, name: 'rose 5' },
        { value: 20, name: 'rose 6' },
        { value: 18, name: 'rose 7' },
        { value: 16, name: 'rose 8' }
      ]
    }
  ]
};

    if (option && typeof option === 'object') {
      myChart.setOption(option);
    }

    window.addEventListener('resize', myChart.resize);
  </script>
</body>
</html>
- 效果图
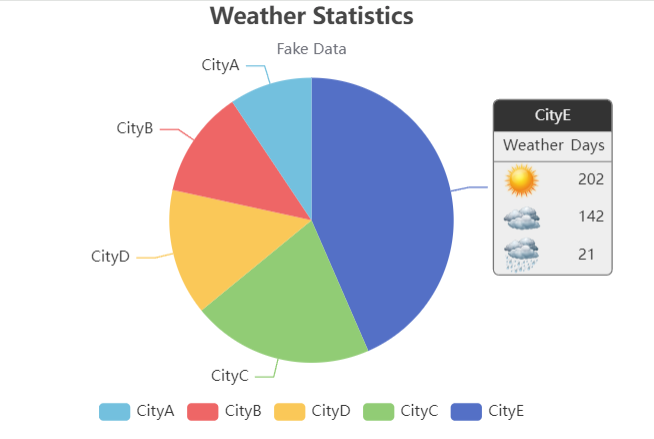
案例4
<!--
	此示例下载自 https://echarts.apache.org/examples/zh/editor.html?c=pie-rich-text
-->
<!DOCTYPE html>
<html lang="en" style="height: 100%">
<head>
  <meta charset="utf-8">
</head>
<body style="height: 100%; margin: 0">
  <div id="container" style="width: 500px;height: 350px"></div>

  <script type="text/javascript" src="https://registry.npmmirror.com/echarts/5/files/dist/echarts.min.js"></script>
  <!-- Uncomment this line if you want to dataTool extension
  <script type="text/javascript" src="https://registry.npmmirror.com/echarts/5/files/dist/extension/dataTool.min.js"></script>
  -->
  <!-- Uncomment this line if you want to use gl extension
  <script type="text/javascript" src="https://registry.npmmirror.com/echarts-gl/2/files/dist/echarts-gl.min.js"></script>
  -->
  <!-- Uncomment this line if you want to echarts-stat extension
  <script type="text/javascript" src="https://registry.npmmirror.com/echarts-stat/latest/files/dist/ecStat.min.js"></script>
  -->
  <!-- Uncomment this line if you want to use map
  <script type="text/javascript" src="https://registry.npmmirror.com/echarts/4.9.0/files/map/js/china.js"></script>
  <script type="text/javascript" src="https://registry.npmmirror.com/echarts/4.9.0/files/map/js/world.js"></script>
  -->
  <!-- Uncomment these two lines if you want to use bmap extension
  <script type="text/javascript" src="https://api.map.baidu.com/api?v=3.0&ak=YOUR_API_KEY"></script>
  <script type="text/javascript" src="https://registry.npmmirror.com/echarts/5/files/dist/extension/bmap.min.js"></script>
  -->

  <script type="text/javascript">
    var dom = document.getElementById('container');
    var myChart = echarts.init(dom, null, {
      renderer: 'canvas',
      useDirtyRect: false
    });
    var app = {};
    var ROOT_PATH = 'https://echarts.apache.org/examples';
    var option;

    const weatherIcons = {
  Sunny: ROOT_PATH + '/data/asset/img/weather/sunny_128.png',
  Cloudy: ROOT_PATH + '/data/asset/img/weather/cloudy_128.png',
  Showers: ROOT_PATH + '/data/asset/img/weather/showers_128.png'
};
option = {
  title: {
    text: 'Weather Statistics',
    subtext: 'Fake Data',
    left: 'center'
  },
  tooltip: {
    trigger: 'item',
    formatter: '{a} <br/>{b} : {c} ({d}%)'
  },
  legend: {
    bottom: 10,
    left: 'center',
    data: ['CityA', 'CityB', 'CityD', 'CityC', 'CityE']
  },
  series: [
    {
      type: 'pie',
      radius: '65%',
      center: ['50%', '50%'],
      selectedMode: 'single',
      data: [
        {
          value: 1548,
          name: 'CityE',
          label: {
            formatter: [
              '{title|{b}}{abg|}',
              '  {weatherHead|Weather}{valueHead|Days}{rateHead|Percent}',
              '{hr|}',
              '  {Sunny|}{value|202}{rate|55.3%}',
              '  {Cloudy|}{value|142}{rate|38.9%}',
              '  {Showers|}{value|21}{rate|5.8%}'
            ].join('\n'),
            backgroundColor: '#eee',
            borderColor: '#777',
            borderWidth: 1,
            borderRadius: 4,
            rich: {
              title: {
                color: '#eee',
                align: 'center'
              },
              abg: {
                backgroundColor: '#333',
                width: '100%',
                align: 'right',
                height: 25,
                borderRadius: [4, 4, 0, 0]
              },
              Sunny: {
                height: 30,
                align: 'left',
                backgroundColor: {
                  image: weatherIcons.Sunny
                }
              },
              Cloudy: {
                height: 30,
                align: 'left',
                backgroundColor: {
                  image: weatherIcons.Cloudy
                }
              },
              Showers: {
                height: 30,
                align: 'left',
                backgroundColor: {
                  image: weatherIcons.Showers
                }
              },
              weatherHead: {
                color: '#333',
                height: 24,
                align: 'left'
              },
              hr: {
                borderColor: '#777',
                width: '100%',
                borderWidth: 0.5,
                height: 0
              },
              value: {
                width: 20,
                padding: [0, 20, 0, 30],
                align: 'left'
              },
              valueHead: {
                color: '#333',
                width: 20,
                padding: [0, 20, 0, 30],
                align: 'center'
              },
              rate: {
                width: 40,
                align: 'right',
                padding: [0, 10, 0, 0]
              },
              rateHead: {
                color: '#333',
                width: 40,
                align: 'center',
                padding: [0, 10, 0, 0]
              }
            }
          }
        },
        { value: 735, name: 'CityC' },
        { value: 510, name: 'CityD' },
        { value: 434, name: 'CityB' },
        { value: 335, name: 'CityA' }
      ],
      emphasis: {
        itemStyle: {
          shadowBlur: 10,
          shadowOffsetX: 0,
          shadowColor: 'rgba(0, 0, 0, 0.5)'
        }
      }
    }
  ]
};

    if (option && typeof option === 'object') {
      myChart.setOption(option);
    }

    window.addEventListener('resize', myChart.resize);
  </script>
</body>
</html>
- 效果图

 浙公网安备 33010602011771号