案例1
<!--
	此示例下载自 https://echarts.apache.org/examples/zh/editor.html?c=boxplot-light-velocity
-->
<!DOCTYPE html>
<html lang="en" style="height: 100%">
<head>
  <meta charset="utf-8">
</head>
<body style="height: 100%; margin: 0">
  <div id="container" style="width: 600px;height: 500px"></div>

  <script type="text/javascript" src="https://registry.npmmirror.com/echarts/5.4.3/files/dist/echarts.min.js"></script>
  <!-- Uncomment this line if you want to dataTool extension
  <script type="text/javascript" src="https://registry.npmmirror.com/echarts/5.4.3/files/dist/extension/dataTool.min.js"></script>
  -->
  <!-- Uncomment this line if you want to use gl extension
  <script type="text/javascript" src="https://registry.npmmirror.com/echarts-gl/2/files/dist/echarts-gl.min.js"></script>
  -->
  <!-- Uncomment this line if you want to echarts-stat extension
  <script type="text/javascript" src="https://registry.npmmirror.com/echarts-stat/latest/files/dist/ecStat.min.js"></script>
  -->
  <!-- Uncomment this line if you want to use map
  <script type="text/javascript" src="https://registry.npmmirror.com/echarts/4.9.0/files/map/js/china.js"></script>
  <script type="text/javascript" src="https://registry.npmmirror.com/echarts/4.9.0/files/map/js/world.js"></script>
  -->
  <!-- Uncomment these two lines if you want to use bmap extension
  <script type="text/javascript" src="https://api.map.baidu.com/api?v=3.0&ak=YOUR_API_KEY"></script>
  <script type="text/javascript" src="https://registry.npmmirror.com/echarts/5.4.3/files/dist/extension/bmap.min.js"></script>
  -->

  <script type="text/javascript">
    var dom = document.getElementById('container');
    var myChart = echarts.init(dom, null, {
      renderer: 'canvas',
      useDirtyRect: false
    });
    var app = {};

    var option;

    option = {
  title: [
    {
      text: 'Michelson-Morley Experiment',
      left: 'center'
    },
    {
      text: 'upper: Q3 + 1.5 * IQR \nlower: Q1 - 1.5 * IQR',
      borderColor: '#999',
      borderWidth: 1,
      textStyle: {
        fontWeight: 'normal',
        fontSize: 14,
        lineHeight: 20
      },
      left: '10%',
      top: '90%'
    }
  ],
  dataset: [
    {
      // prettier-ignore
      source: [
                [850, 740, 900, 1070, 930, 850, 950, 980, 980, 880, 1000, 980, 930, 650, 760, 810, 1000, 1000, 960, 960],
                [960, 940, 960, 940, 880, 800, 850, 880, 900, 840, 830, 790, 810, 880, 880, 830, 800, 790, 760, 800],
                [880, 880, 880, 860, 720, 720, 620, 860, 970, 950, 880, 910, 850, 870, 840, 840, 850, 840, 840, 840],
                [890, 810, 810, 820, 800, 770, 760, 740, 750, 760, 910, 920, 890, 860, 880, 720, 840, 850, 850, 780],
                [890, 840, 780, 810, 760, 810, 790, 810, 820, 850, 870, 870, 810, 740, 810, 940, 950, 800, 810, 870]
            ]
    },
    {
      transform: {
        type: 'boxplot',
        config: { itemNameFormatter: 'expr {value}' }
      }
    },
    {
      fromDatasetIndex: 1,
      fromTransformResult: 1
    }
  ],
  tooltip: {
    trigger: 'item',
    axisPointer: {
      type: 'shadow'
    }
  },
  grid: {
    left: '10%',
    right: '10%',
    bottom: '15%'
  },
  xAxis: {
    type: 'category',
    boundaryGap: true,
    nameGap: 30,
    splitArea: {
      show: false
    },
    splitLine: {
      show: false
    }
  },
  yAxis: {
    type: 'value',
    name: 'km/s minus 299,000',
    splitArea: {
      show: true
    }
  },
  series: [
    {
      name: 'boxplot',
      type: 'boxplot',
      datasetIndex: 1
    },
    {
      name: 'outlier',
      type: 'scatter',
      datasetIndex: 2
    }
  ]
};

    if (option && typeof option === 'object') {
      myChart.setOption(option);
    }

    window.addEventListener('resize', myChart.resize);
  </script>
</body>
</html>
- 效果图

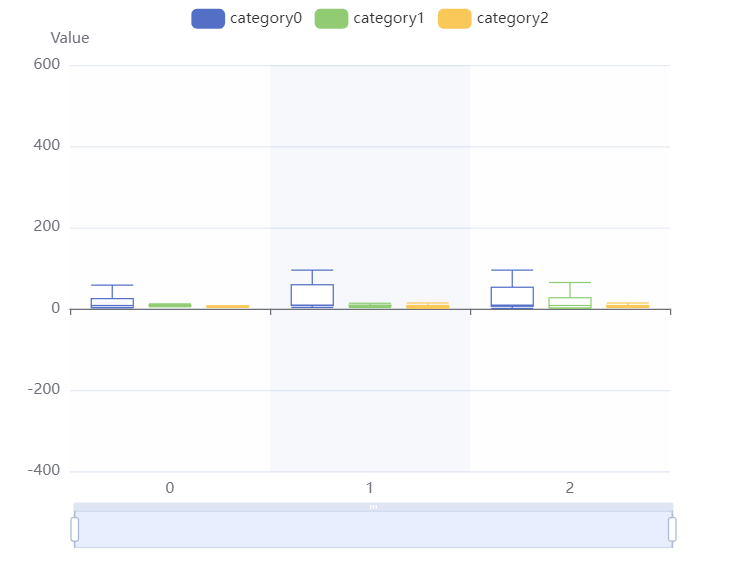
案例2
<!--
	此示例下载自 https://echarts.apache.org/examples/zh/editor.html?c=boxplot-multi
-->
<!DOCTYPE html>
<html lang="en" style="height: 100%">
<head>
  <meta charset="utf-8">
</head>
<body style="height: 100%; margin: 0">
  <div id="container" style="width: 600px;height: 500px"></div>

  <script type="text/javascript" src="https://registry.npmmirror.com/echarts/5.4.3/files/dist/echarts.min.js"></script>
  <!-- Uncomment this line if you want to dataTool extension
  <script type="text/javascript" src="https://registry.npmmirror.com/echarts/5.4.3/files/dist/extension/dataTool.min.js"></script>
  -->
  <!-- Uncomment this line if you want to use gl extension
  <script type="text/javascript" src="https://registry.npmmirror.com/echarts-gl/2/files/dist/echarts-gl.min.js"></script>
  -->
  <!-- Uncomment this line if you want to echarts-stat extension
  <script type="text/javascript" src="https://registry.npmmirror.com/echarts-stat/latest/files/dist/ecStat.min.js"></script>
  -->
  <!-- Uncomment this line if you want to use map
  <script type="text/javascript" src="https://registry.npmmirror.com/echarts/4.9.0/files/map/js/china.js"></script>
  <script type="text/javascript" src="https://registry.npmmirror.com/echarts/4.9.0/files/map/js/world.js"></script>
  -->
  <!-- Uncomment these two lines if you want to use bmap extension
  <script type="text/javascript" src="https://api.map.baidu.com/api?v=3.0&ak=YOUR_API_KEY"></script>
  <script type="text/javascript" src="https://registry.npmmirror.com/echarts/5.4.3/files/dist/extension/bmap.min.js"></script>
  -->

  <script type="text/javascript">
    var dom = document.getElementById('container');
    var myChart = echarts.init(dom, null, {
      renderer: 'canvas',
      useDirtyRect: false
    });
    var app = {};

    var option;

    // Generate data.
// function makeData() {
//   let data = [];
//   for (let i = 0; i < 18; i++) {
//     let cate = [];
//     for (let j = 0; j < 100; j++) {
//       cate.push(Math.random() * 200);
//     }
//     data.push(cate);
//   }
//   return data;
// }
// const data0 = makeData();
// const data1 = makeData();
// const data2 = makeData();
const data0 = [[2,25,87,3,8],[9,59,8,95,3],[1,95,9,53,6]];
const data1 = [[9,84,7,5,7],[3,55,8,6,9],[2,95,8,27,1]];
const data2 = [[6,5,38,1,6],[4,5,8,52,1],[4,8,75,3,6]];
option = {
  title: {
    text: 'Multiple Categories',
    left: 'center'
  },
  dataset: [
    {
      source: data0
    },
    {
      source: data1
    },
    {
      source: data2
    },
    {
      fromDatasetIndex: 0,
      transform: { type: 'boxplot' }
    },
    {
      fromDatasetIndex: 1,
      transform: { type: 'boxplot' }
    },
    {
      fromDatasetIndex: 2,
      transform: { type: 'boxplot' }
    }
  ],
  legend: {
    top: '10%'
  },
  tooltip: {
    trigger: 'item',
    axisPointer: {
      type: 'shadow'
    }
  },
  grid: {
    left: '10%',
    top: '20%',
    right: '10%',
    bottom: '15%'
  },
  xAxis: {
    type: 'category',
    boundaryGap: true,
    nameGap: 30,
    splitArea: {
      show: true
    },
    splitLine: {
      show: false
    }
  },
  yAxis: {
    type: 'value',
    name: 'Value',
    min: -400,
    max: 600,
    splitArea: {
      show: false
    }
  },
  dataZoom: [
    {
      type: 'inside',
      start: 0,
      end: 20
    },
    {
      show: true,
      type: 'slider',
      top: '90%',
      xAxisIndex: [0],
      start: 0,
      end: 20
    }
  ],
  series: [
    {
      name: 'category0',
      type: 'boxplot',
      datasetIndex: 3
    },
    {
      name: 'category1',
      type: 'boxplot',
      datasetIndex: 4
    },
    {
      name: 'category2',
      type: 'boxplot',
      datasetIndex: 5
    }
  ]
};

    if (option && typeof option === 'object') {
      myChart.setOption(option);
    }

    window.addEventListener('resize', myChart.resize);
  </script>
</body>
</html>
- 效果图

 浙公网安备 33010602011771号